You can create an alert rule and select a mechanism to notify you of the incident. Logpoint can notify you via Email, Syslog, SNMP, HTTP, or SSH. You have the flexibility to design an alert mechanism based on your requirements.
Selecting Page View of Alert Rules
You can view the alert rules in two ways:
Tabular view
Coverage view
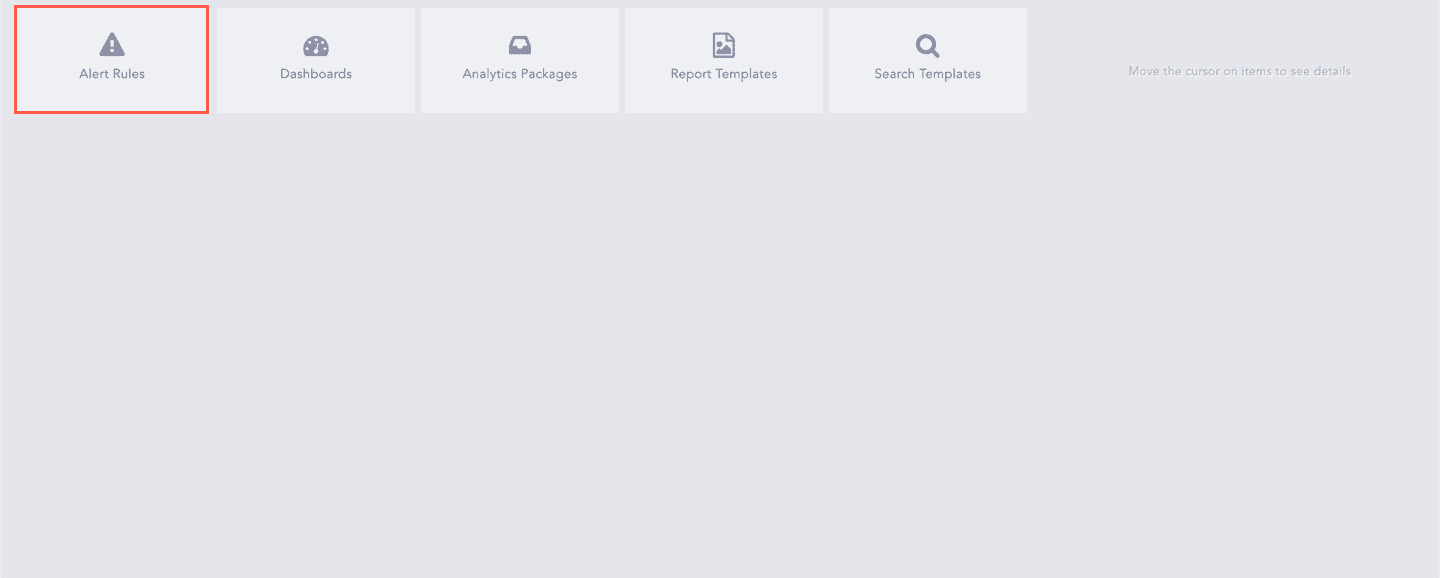
Go to Settings >> Logpoint Configuration >> Alert Rules.
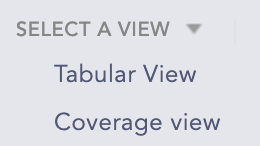
Select a view from the drop-down.
Note
Only the alert rules under My Rules, Used Rules, Vendor Rules, and used Shared Rules can be viewed from the views.
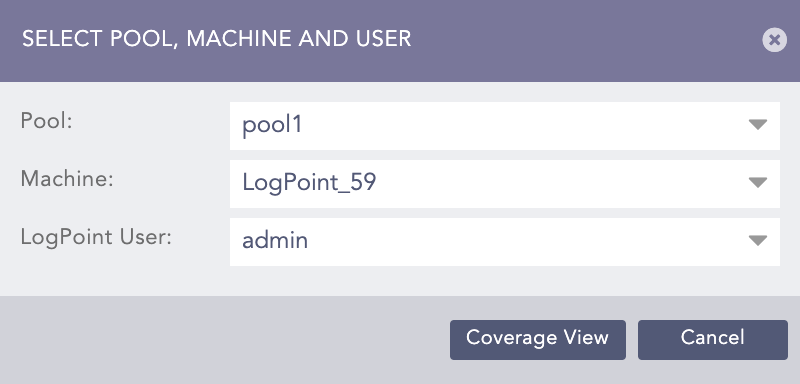
Select a Pool, a Machine, and a Logpoint User.
Click Coverage View/Tabular View.
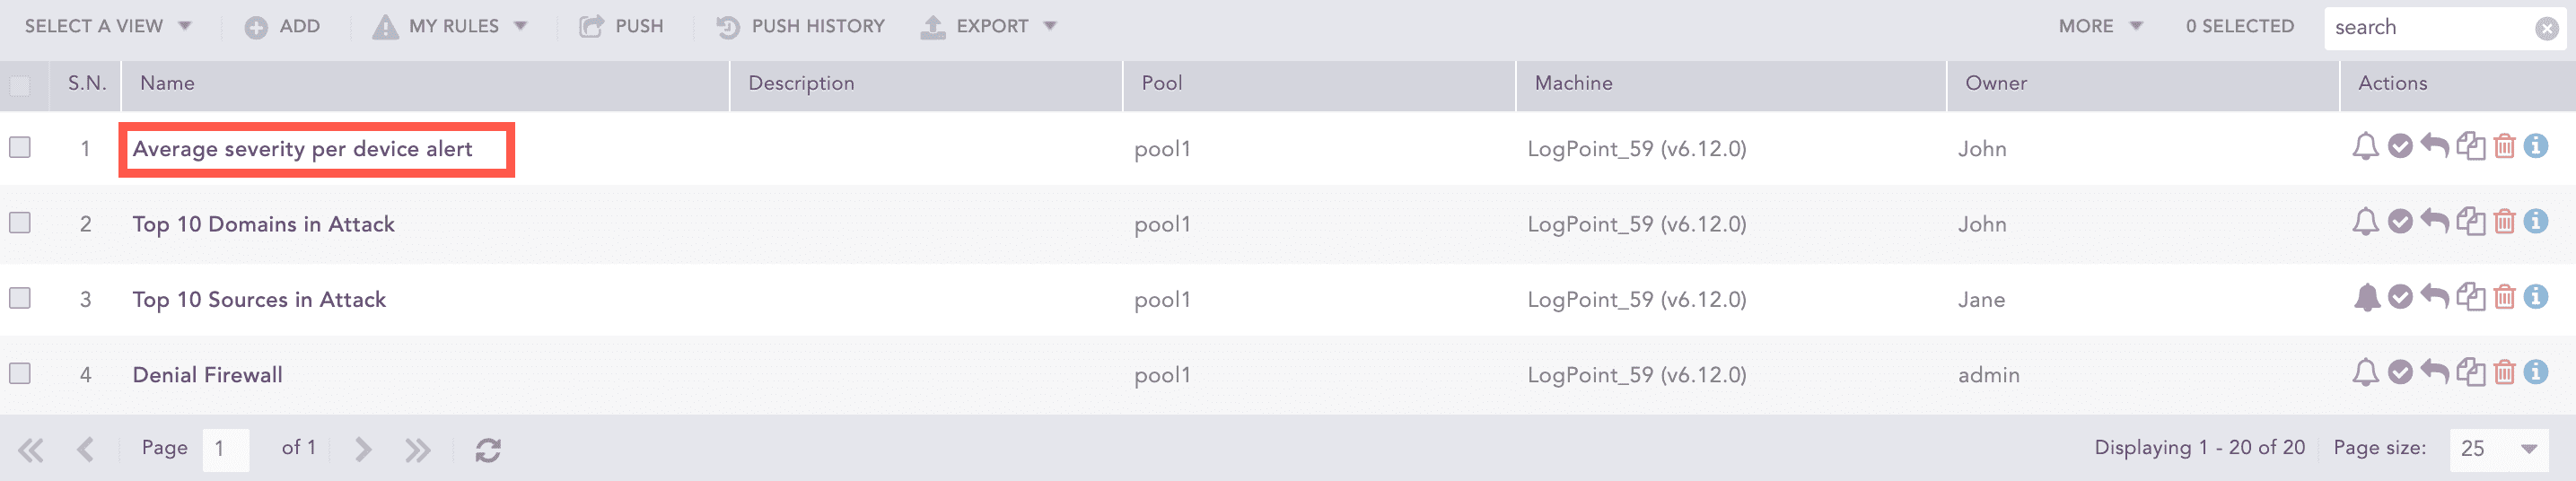
Tabular View
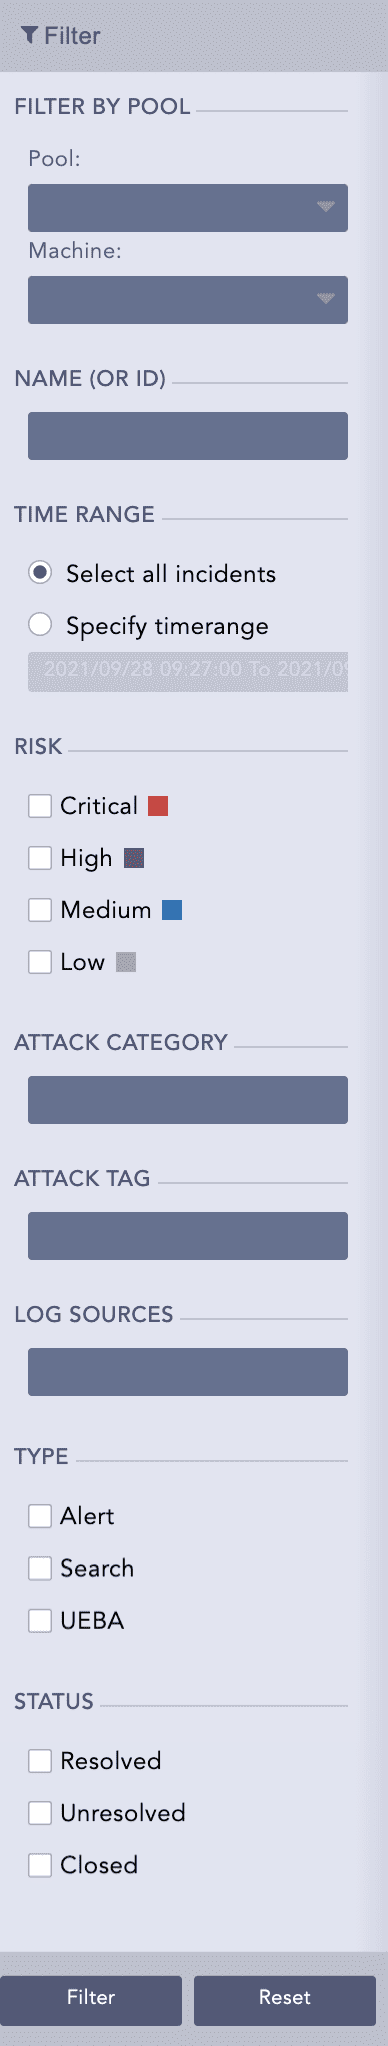
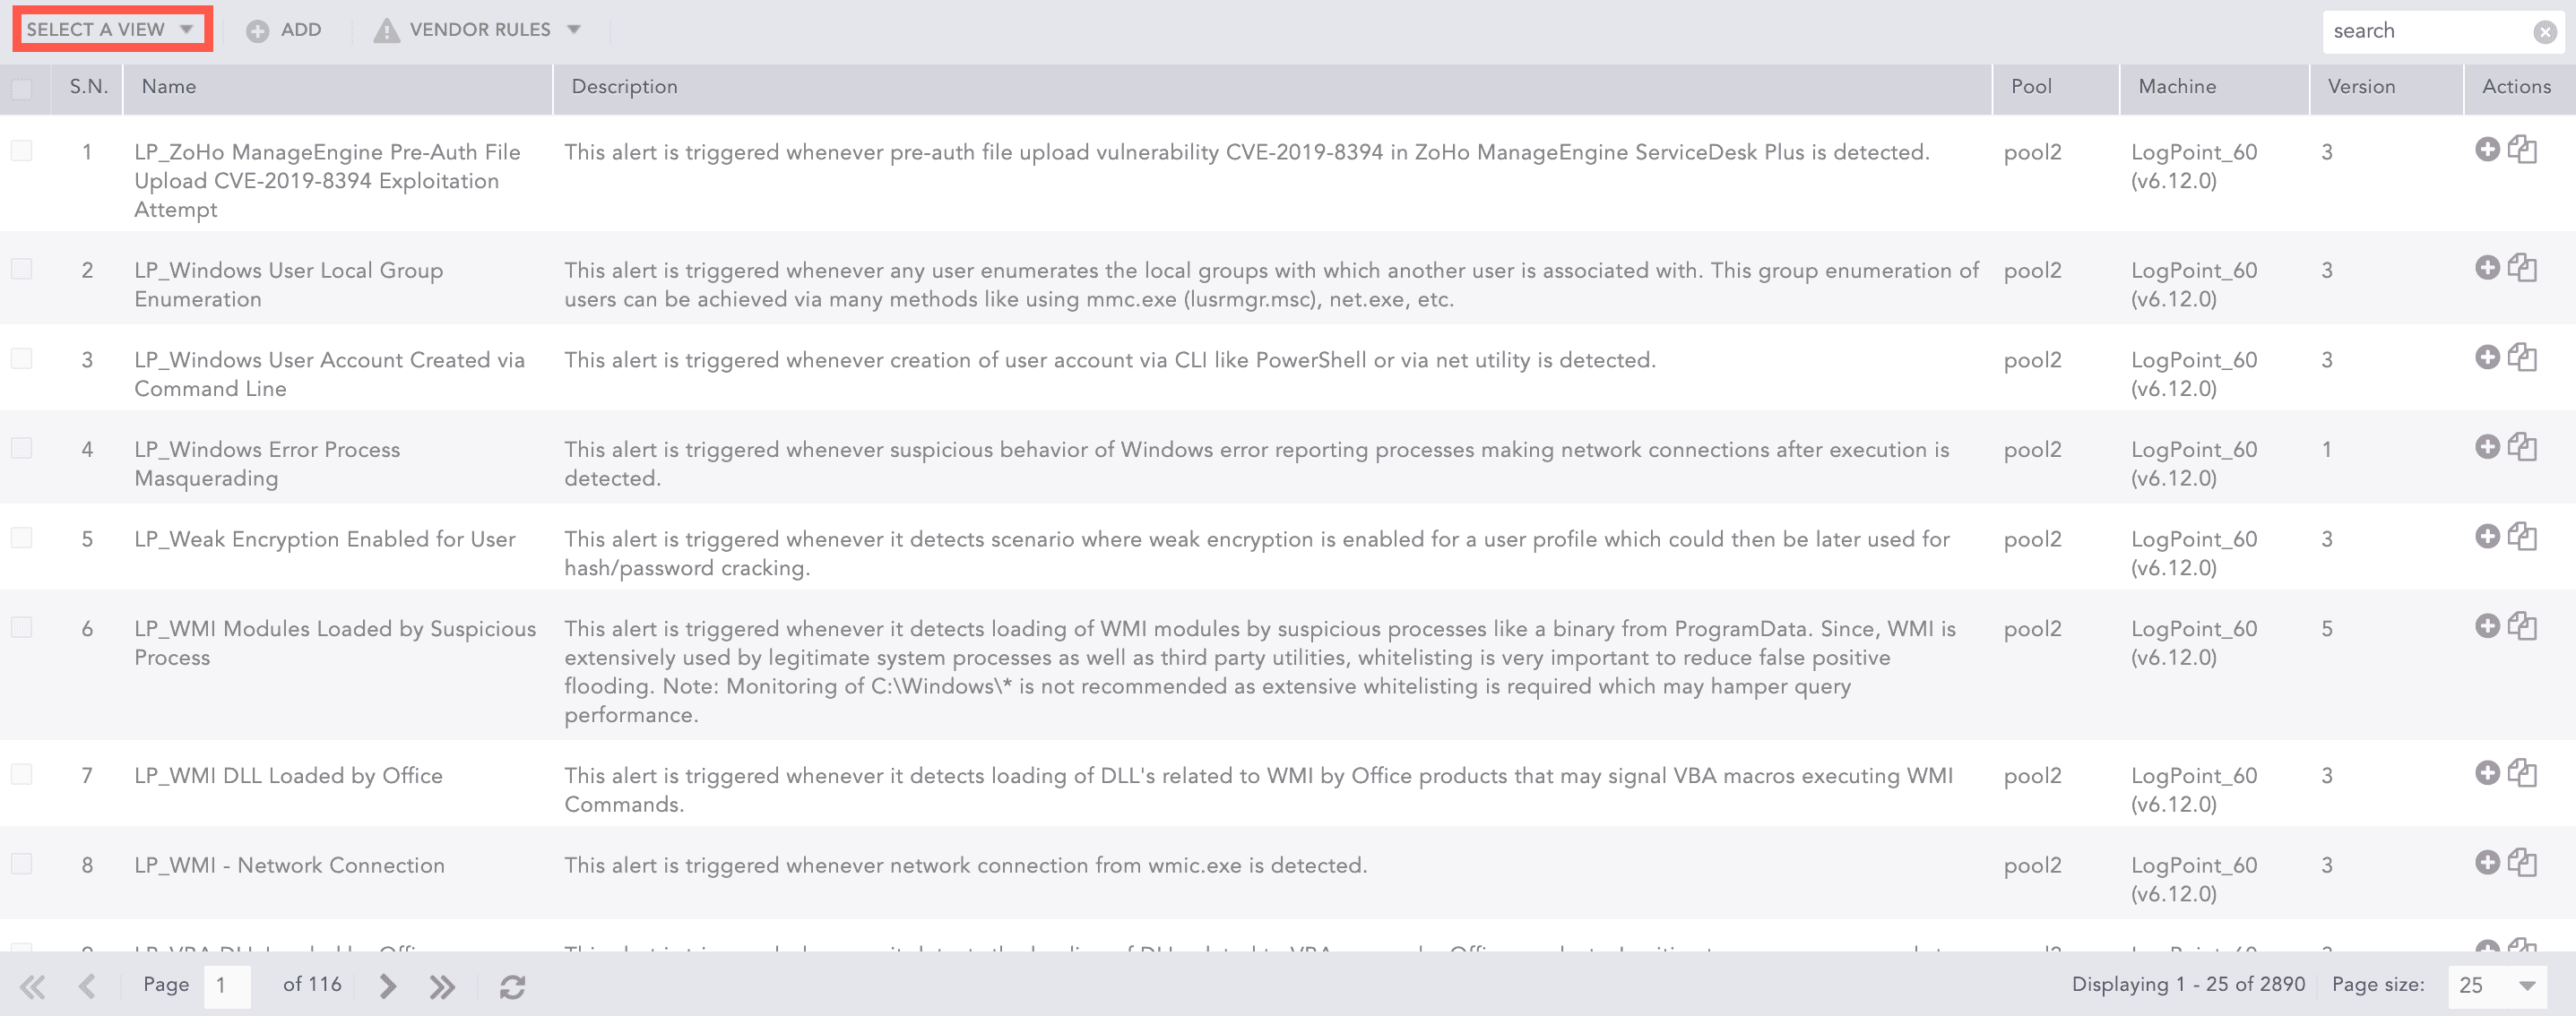
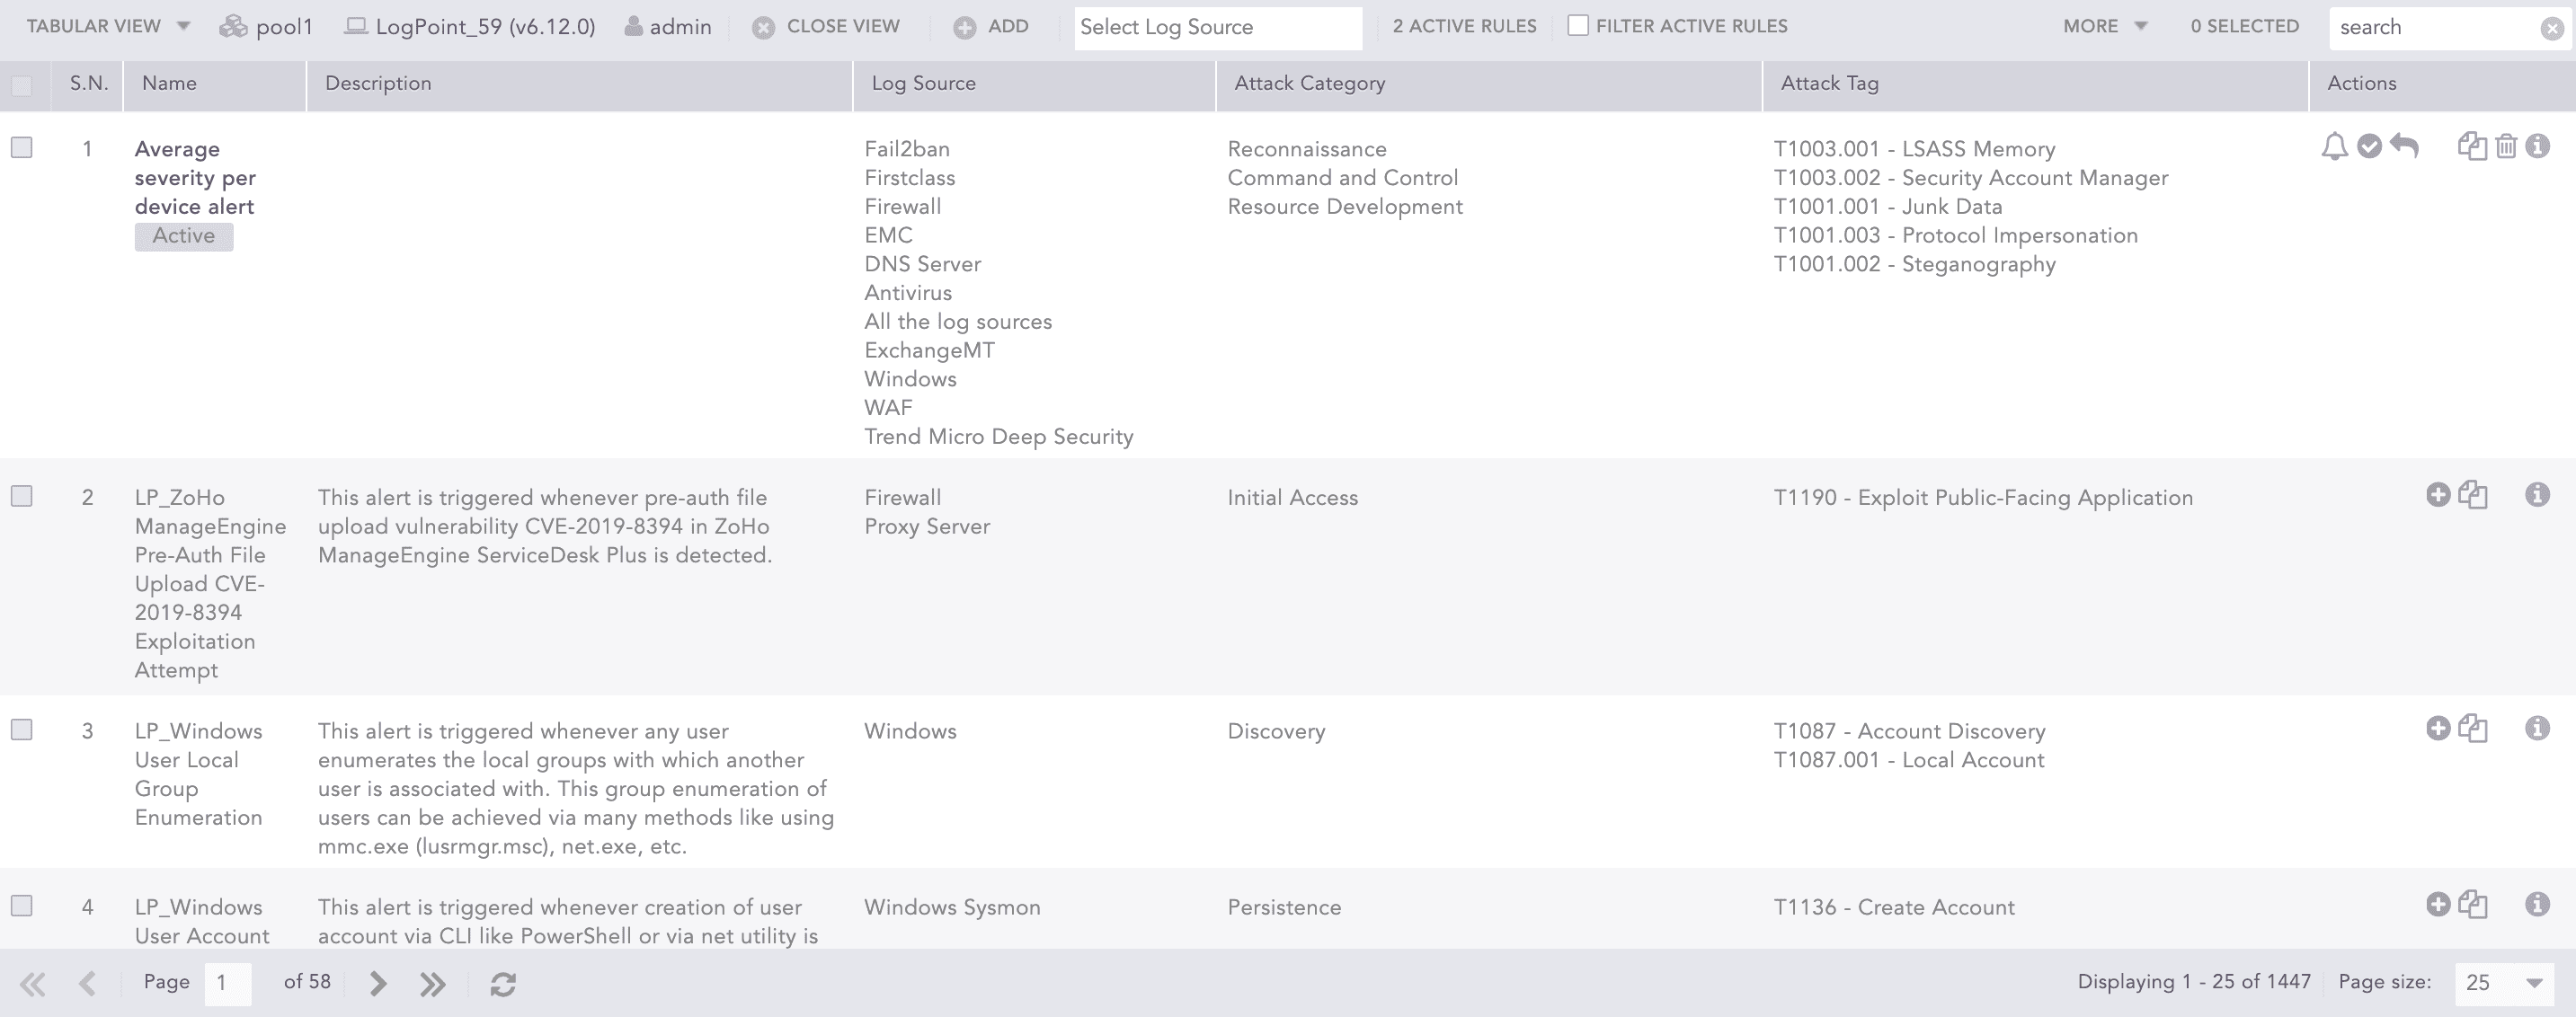
Select Tabular View to display additional columns that list the Log Source, Attack Category, and Attack Tag of the alert rules. You can also see whether the alert rule is active or inactive in the Name column.
Note
You can filter alert rules by multiple log sources from Logpoint v7.4.0 and later, prior to v7.4.0 you can only apply a single alert rule as a filter.
Coverage View
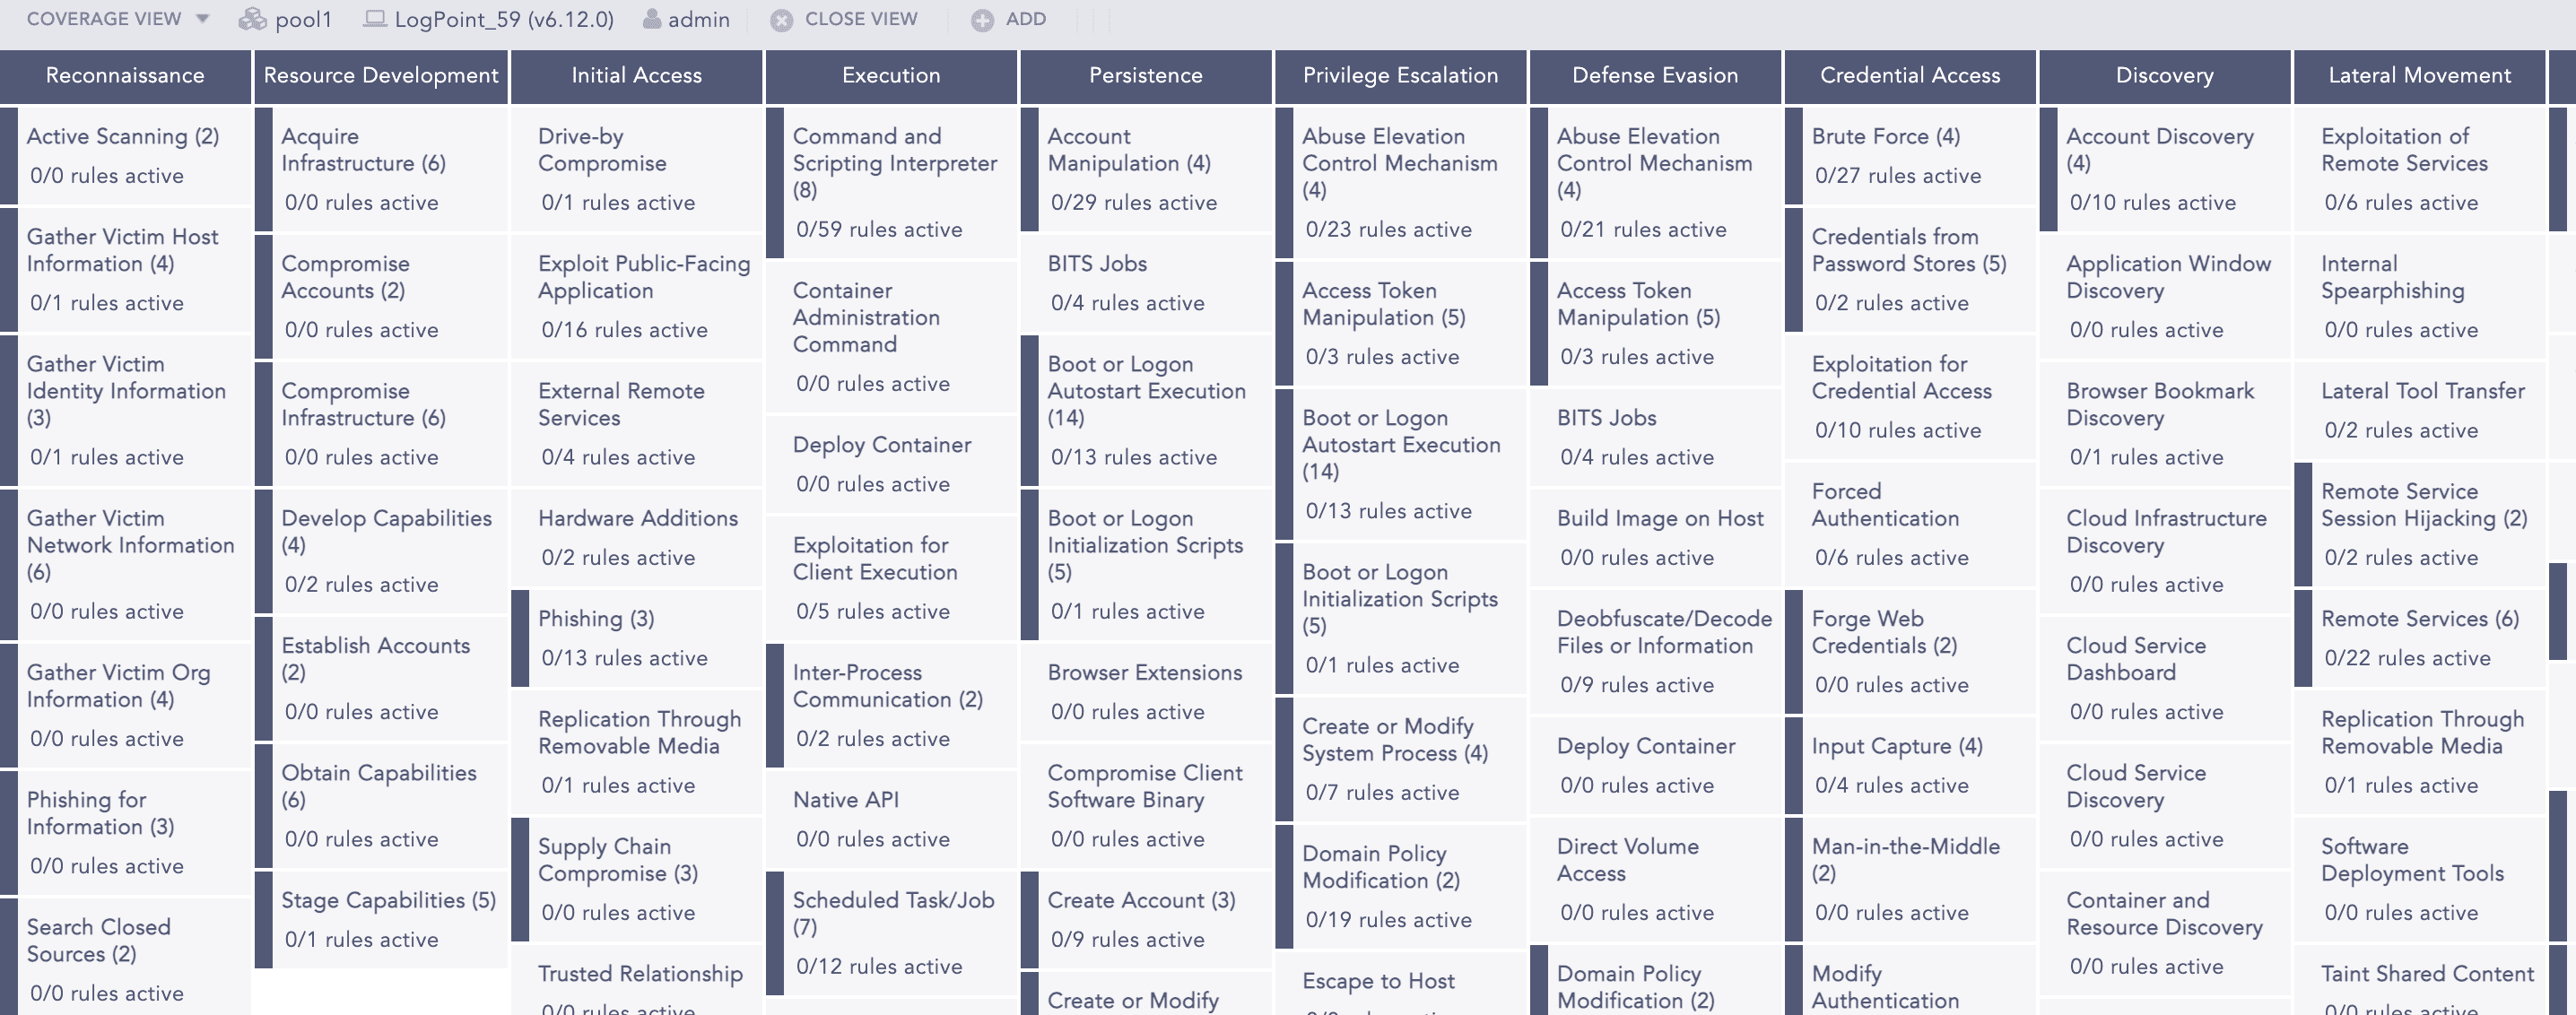
Select Coverage view to view the categorization of the alert rules based on various attack categories and attack tags associated with the attack tactics, attack techniques and, attack sub-techniques of the MITRE attack framework. The attack categories are displayed as column headers with the respective attack tags listed under. You can further drill down the attack tags.
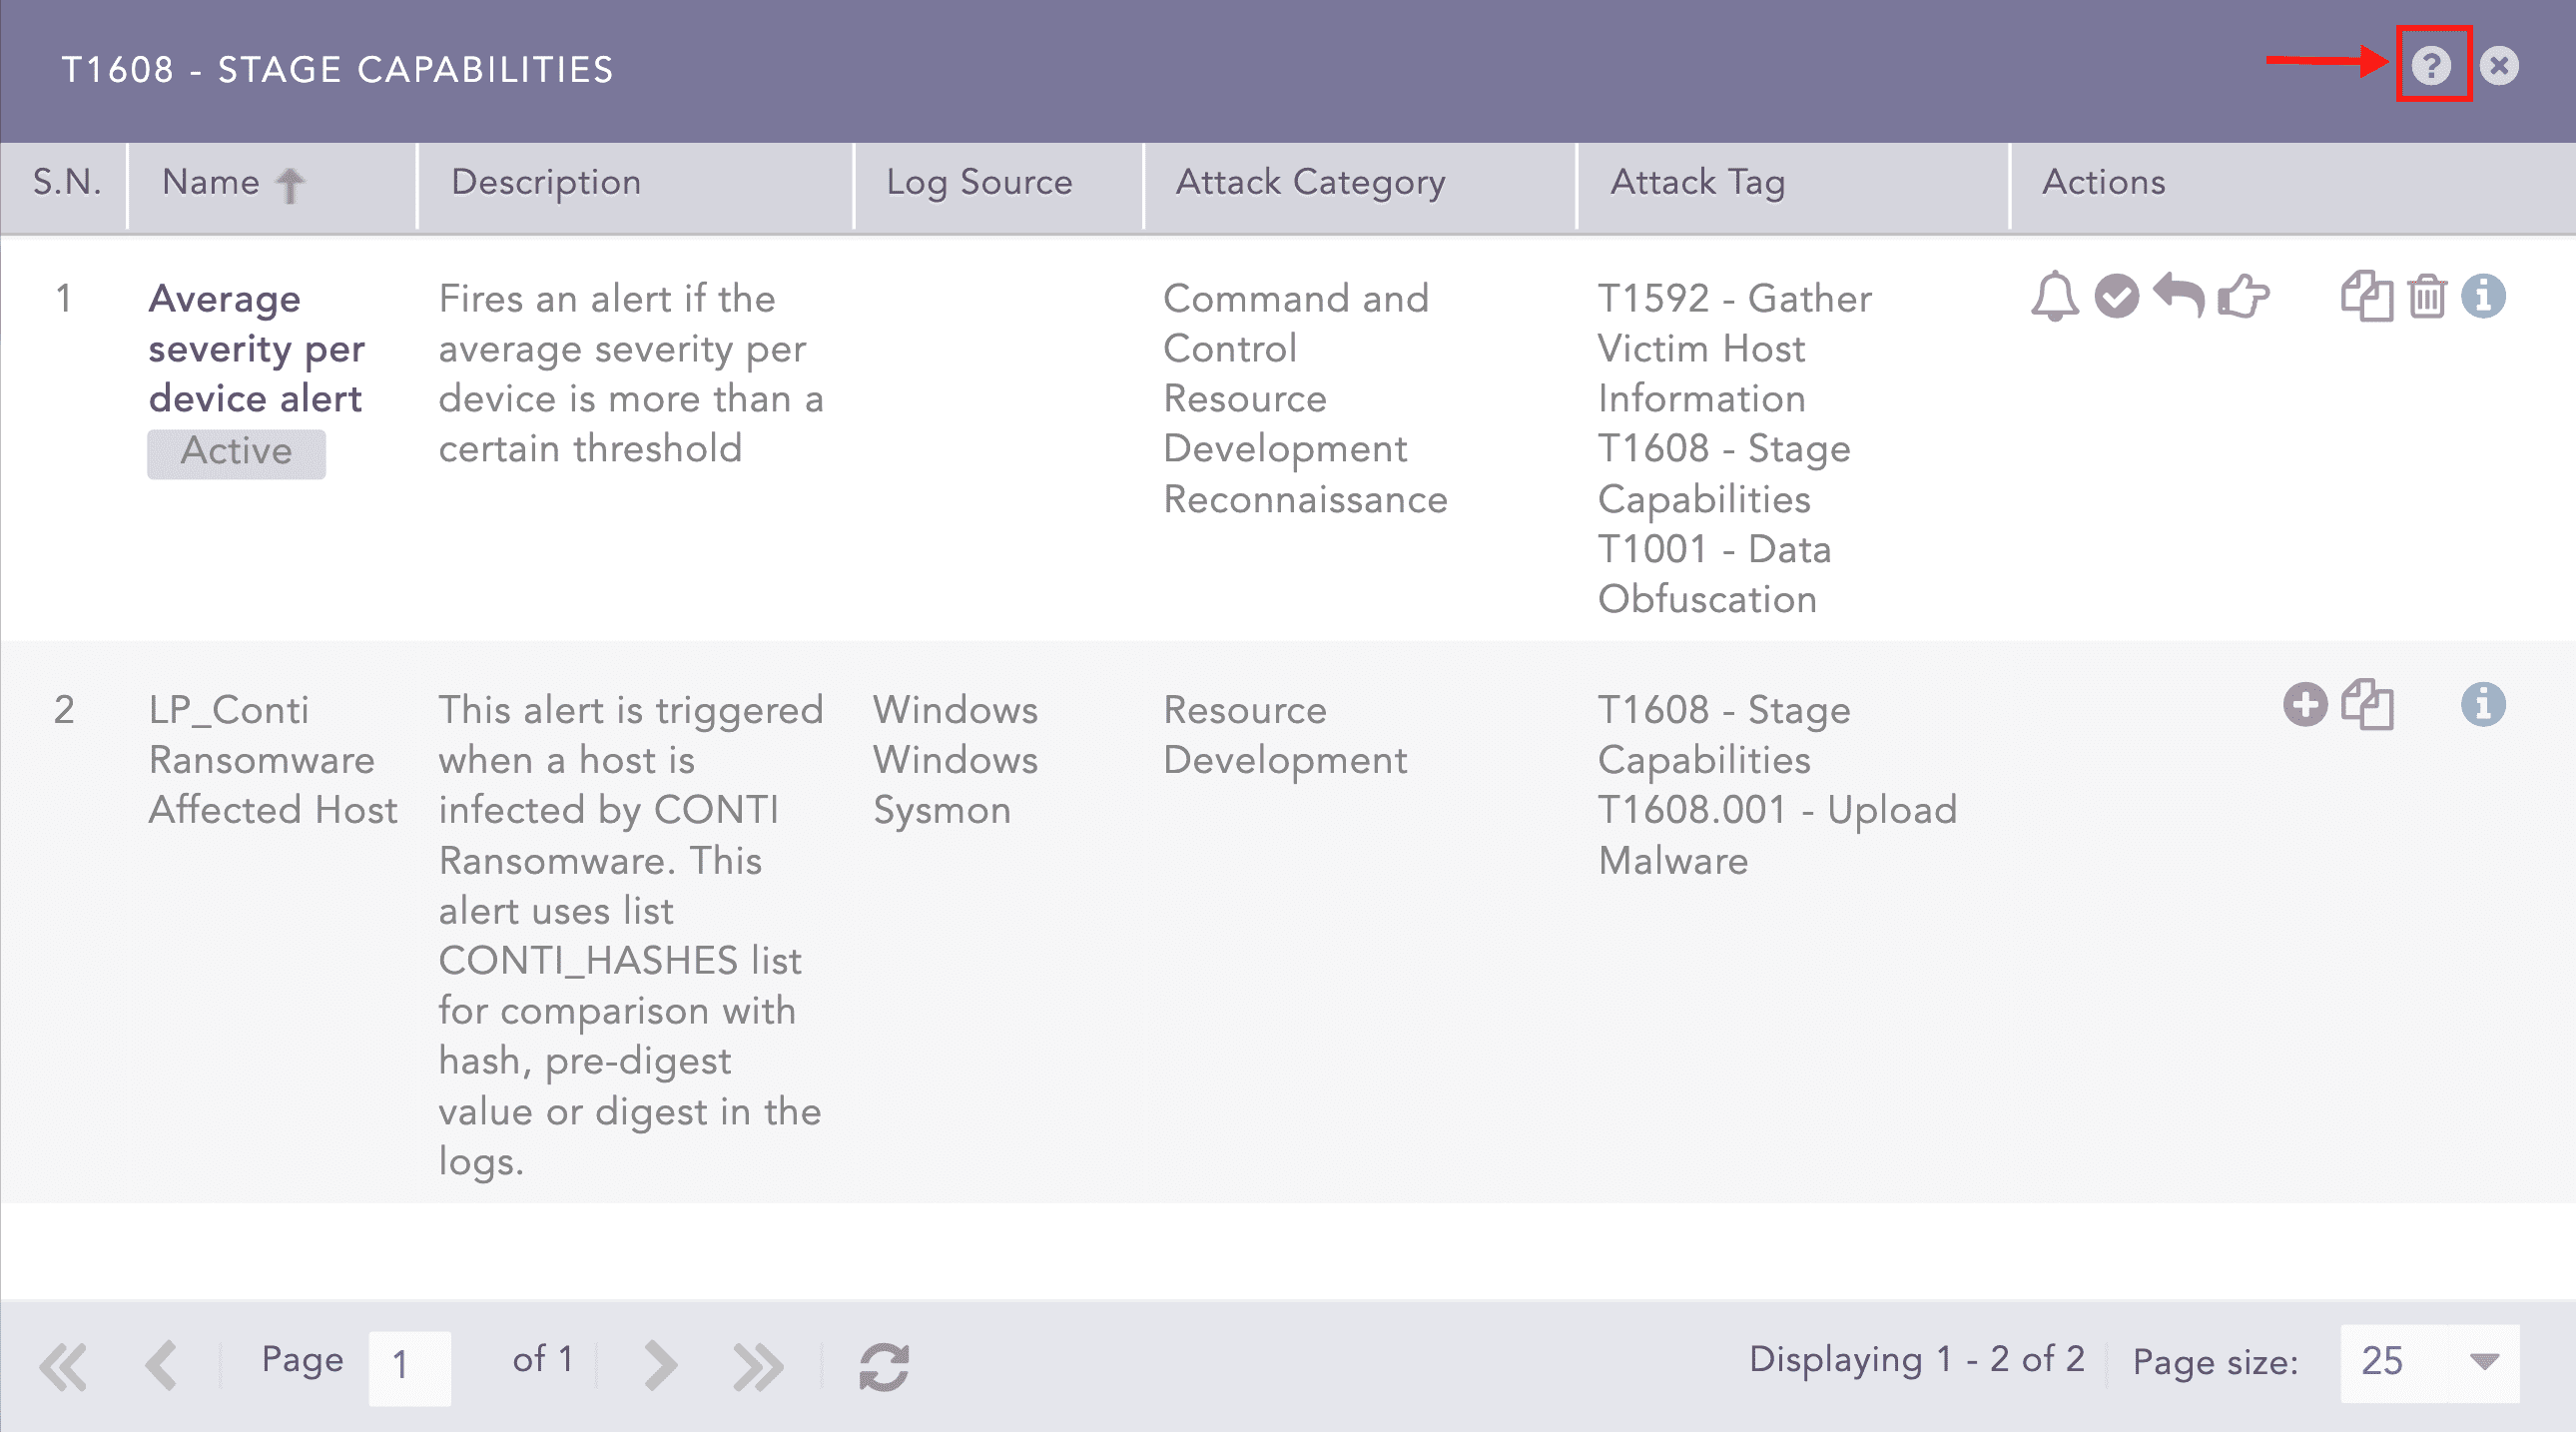
You can click the attack tags to view the list of associated alerts rules. The alert rules are listed as similar to the tabular view.
Note
The total count of active alerts rules with respect to the total number of alert rules is highlighted in green under the attack tag.
The total count of alert rules doesn’t change when the vendor alert rules are used, however the used vendor alerts will be listed along with the vendor alert rule in the dialog box.
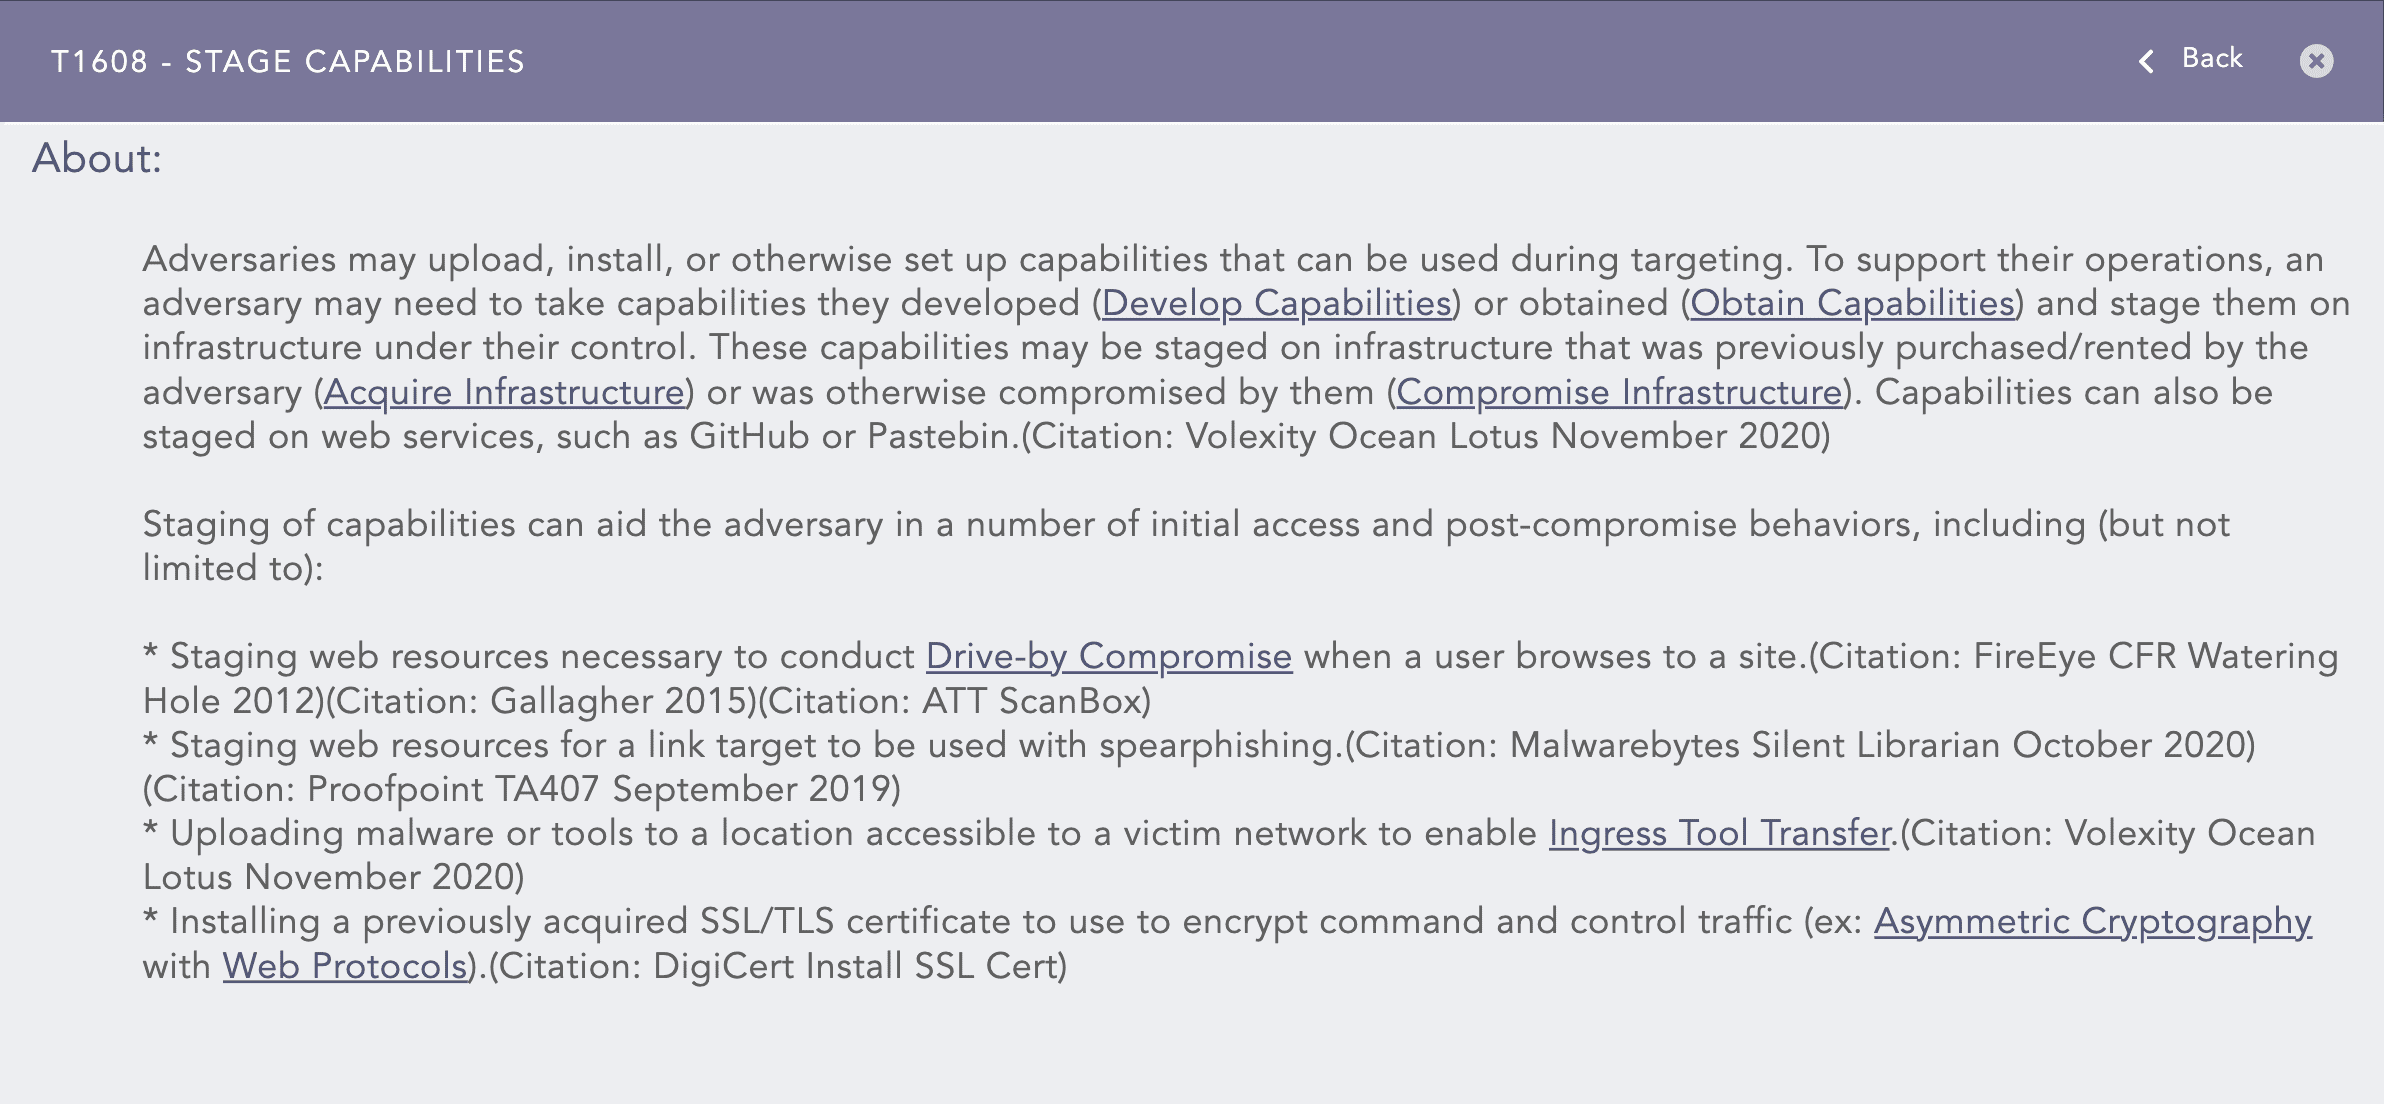
Click the Help ( ) icon on the top of the dialog box to view the description of the attack tag associated with the attack techniques and sub-techniques of the MITRE attack framework.
View Actions
The tabular/coverage view consists of an action bar allowing you to perform the following actions:
Pool
Shows the pool name that you have selected for the view. You can click the pool name to open the Select Pool, Machine and User pop-up where you can make the necessary changes.
Machine
Shows the name of the machine that you have selected for the view. You can click the machine name to open the Select Pool, Machine and User pop-up where you can make the necessary changes.
User
Shows the name of the user that you have selected for the view. You can click the user name to open the Select Pool, Machine and User pop-up where you can make the necessary changes.
Close view
Allows you to close the tabular/coverage view and return to the My Alert Rules page.
Add
Allows you to create a new alert rule using the alert creation wizard. Go to Creating an Alert Rule for more details.
Select Log Source
Allows you to filter the alert rules according to the log sources using the drop-down. The drop-down is only available for tabular view.
Filter Active Rules
Allows you to view only the active alert rules by selecting the checkbox. This checkbox is only available for tabular view.
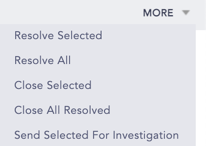
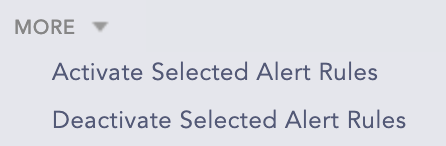
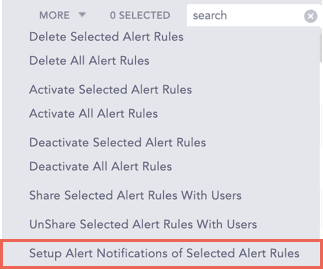
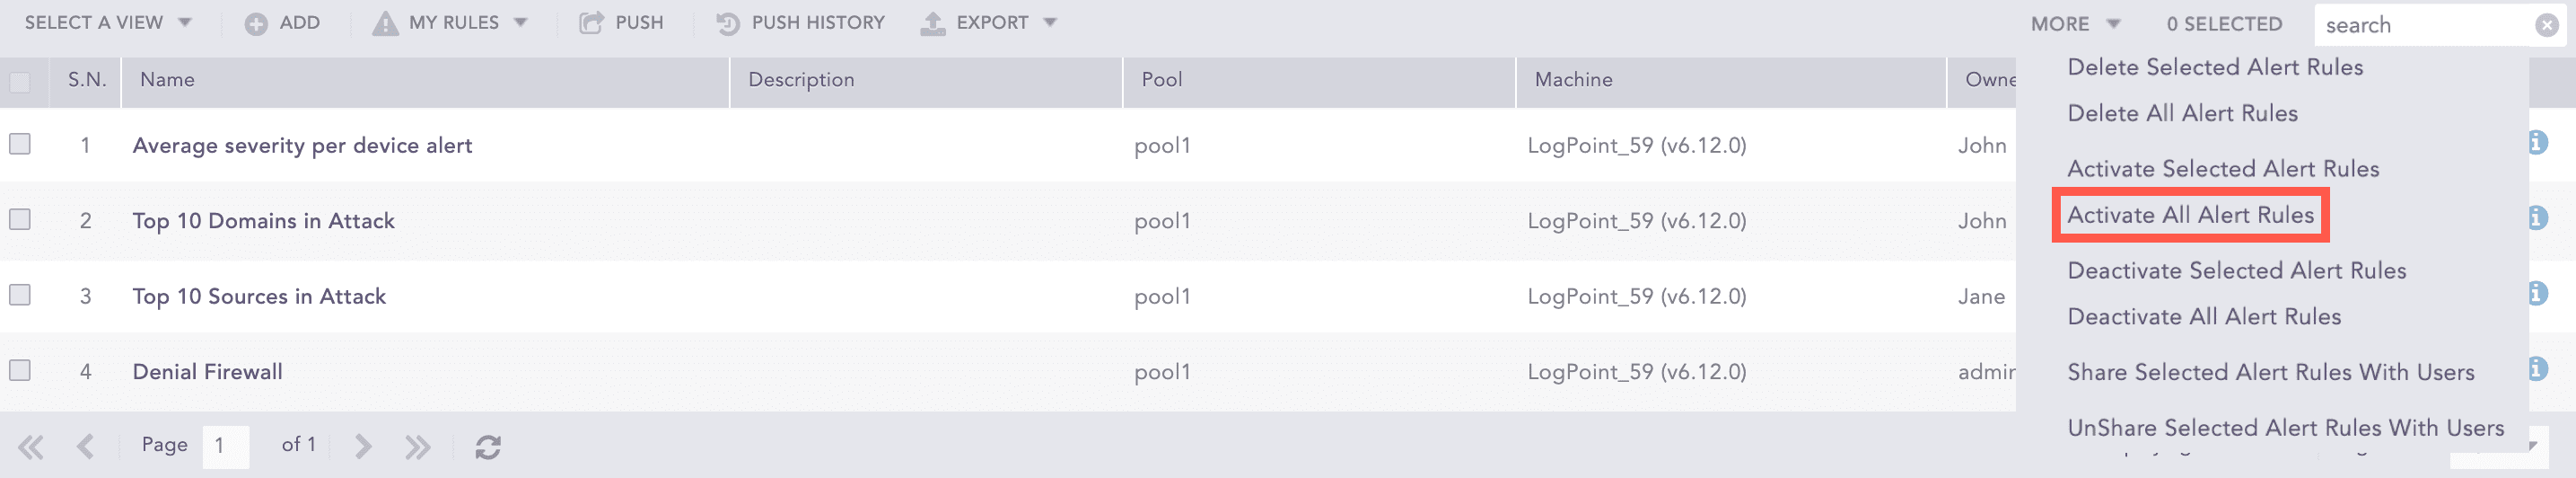
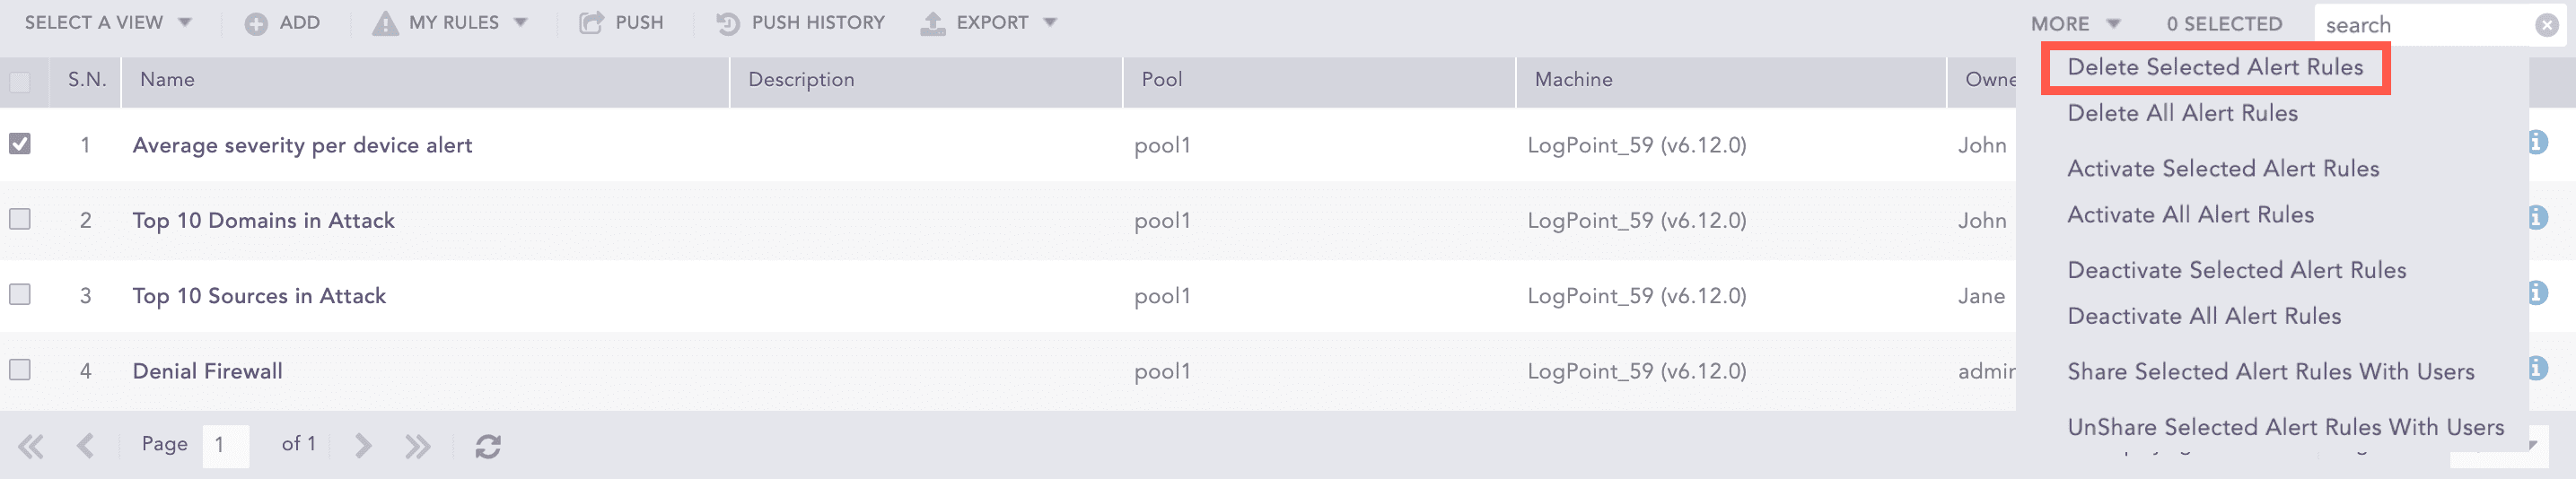
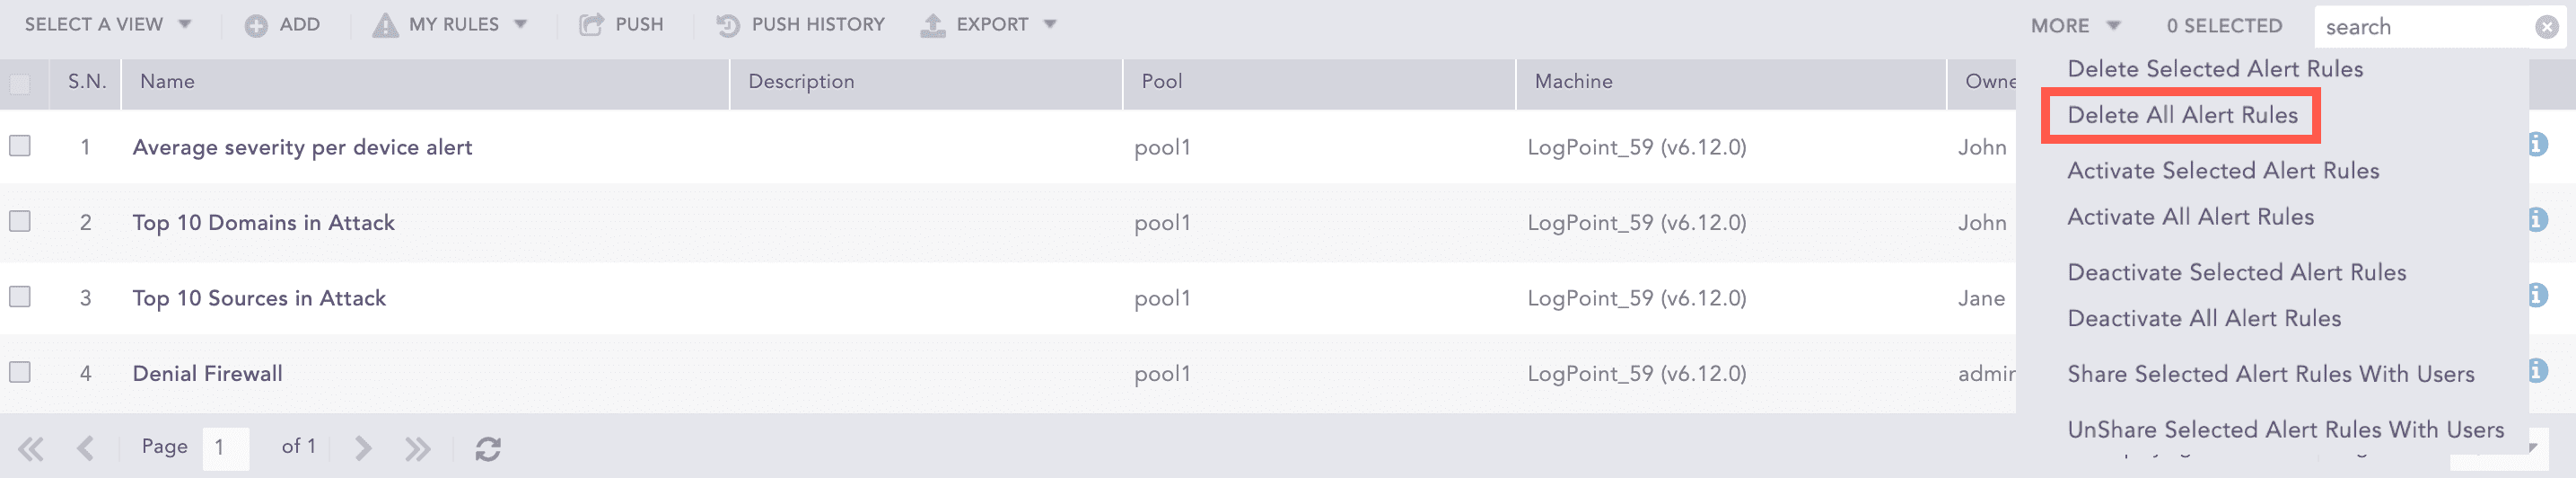
More
The More drop-down near the top-right corner of the tabular view page lists additional actions.
Note
You cannot activate or deactivate vendor rules from the Tabular View.
Creating an Alert Rule
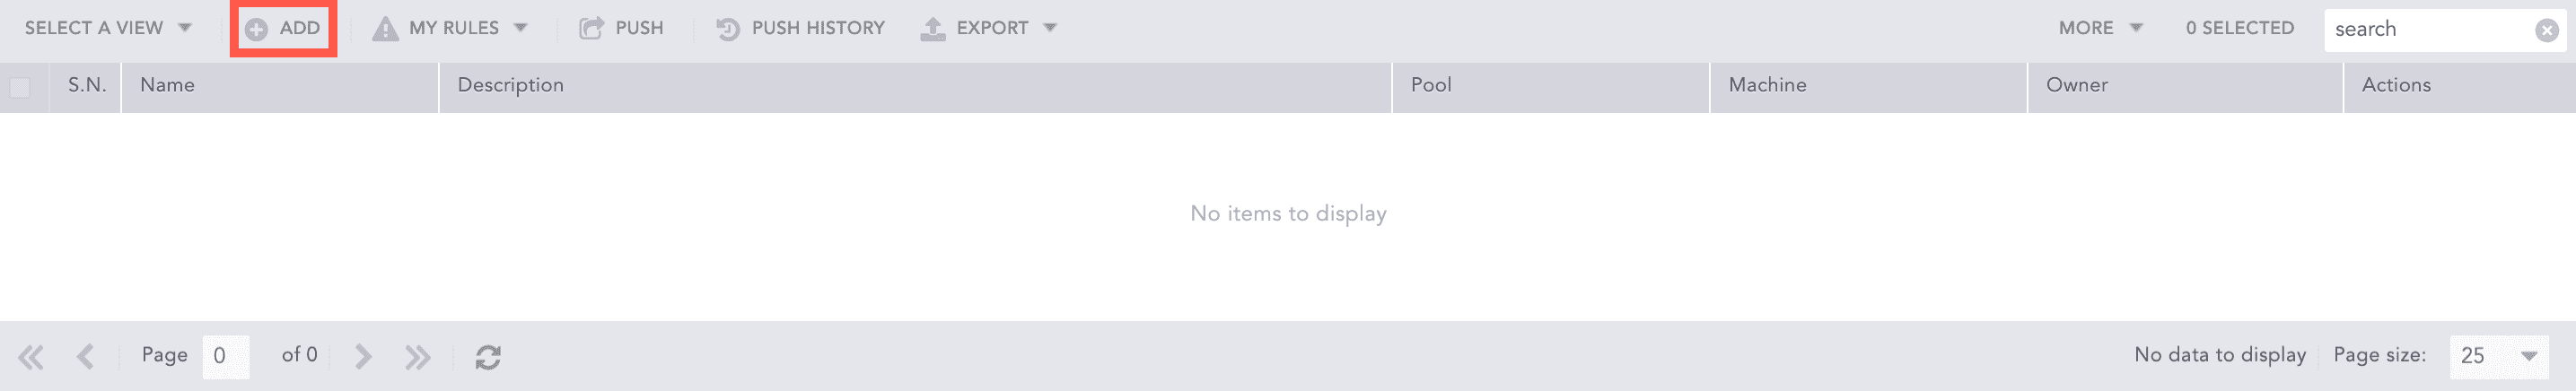
Go to Settings >> Logpoint Configuration >> Alert Rules.
Click Add.
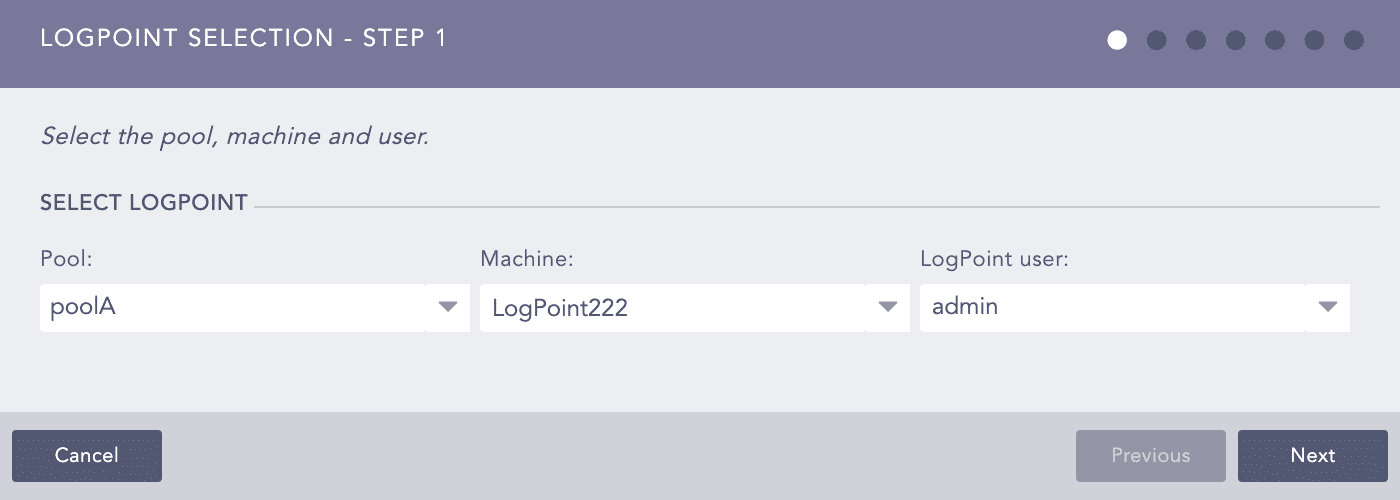
Select Pool, Machine, and Logpoint user in the Select Logpoint field where you want to create the Alert Rule.
Click Next.
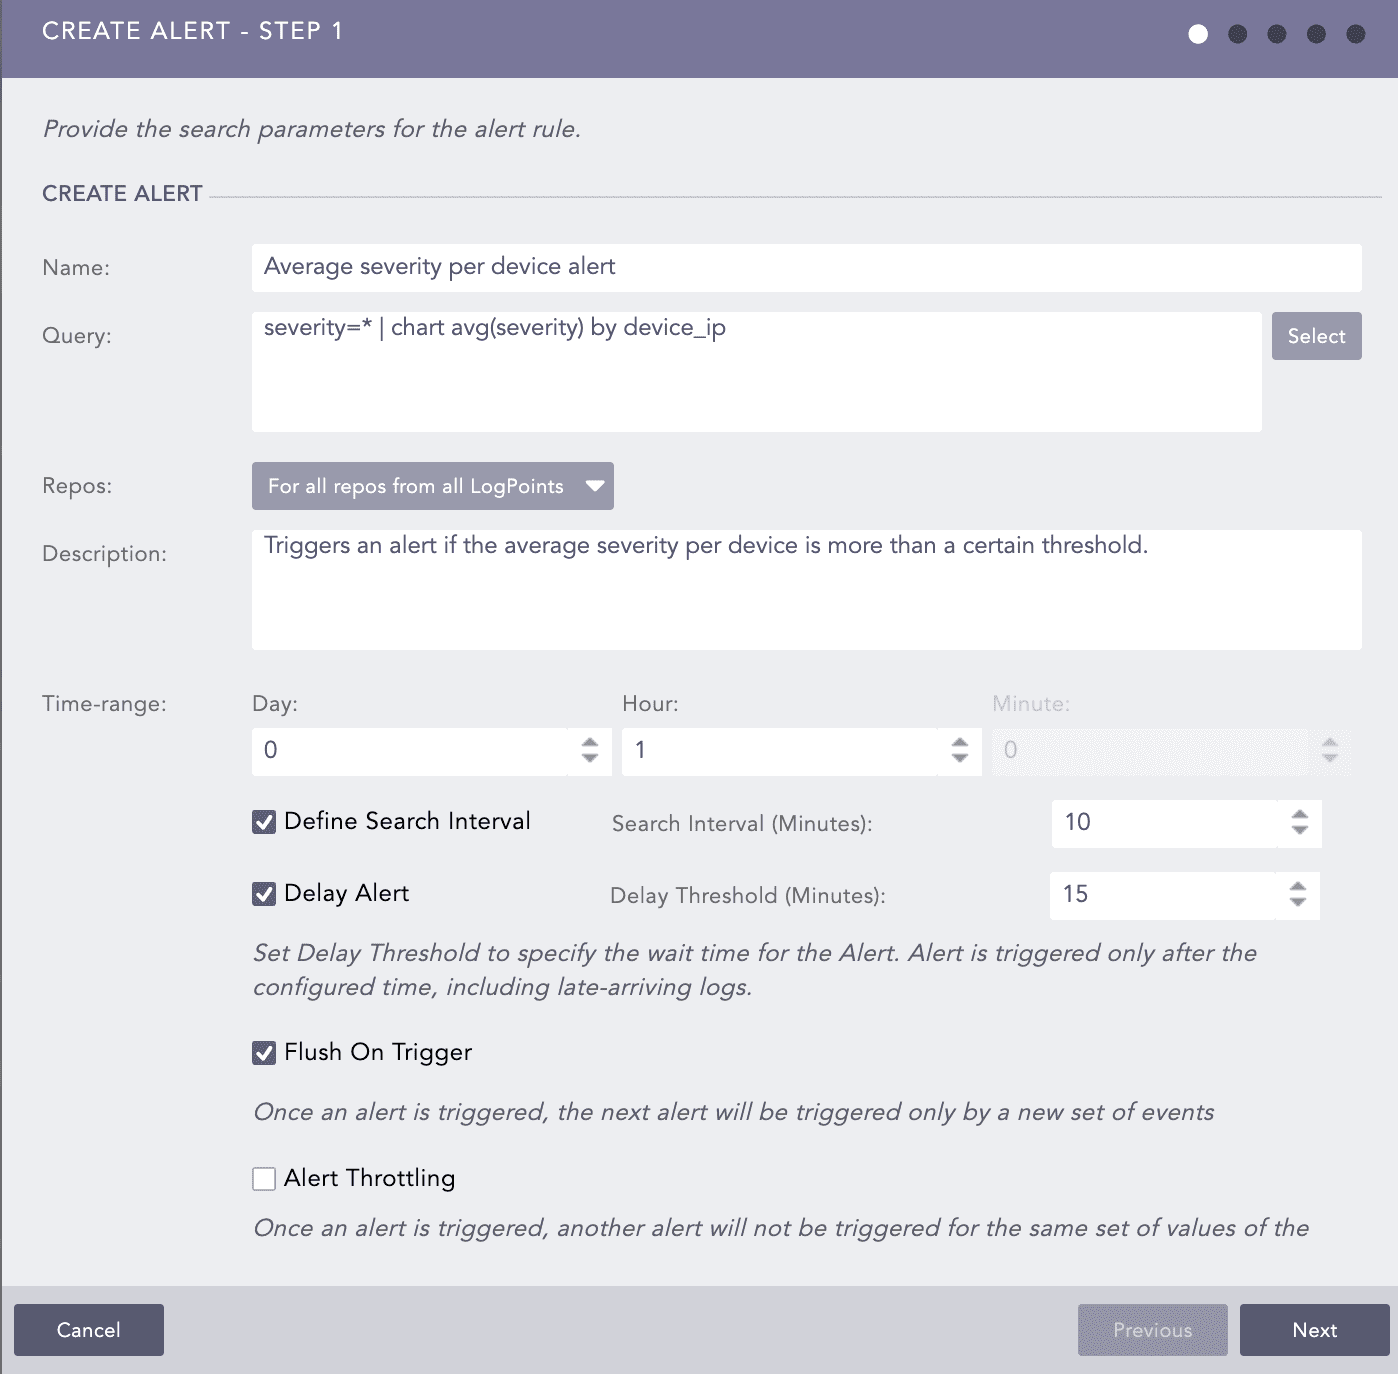
Enter the Name of the alert.
Enter the Query for which you want the alert to trigger an incident. You can either manually enter a search query or pick a query from the Advanced Query Picker using the Select option.
Note
In Data Privacy Module enabled systems, the values for all the fields configured under the Data Privacy Module appear in encrypted form. For queries using specified values for the configured fields, Logpoint does not generate any incidents. However, for the queries specified with all values, the incident is generated with encrypted values of the fields.
For example, if you have configured the device_name field under the Data Privacy Module, then the query device_name=localhost does not generate any incident. However, the query device_name=* generates incidents with encrypted values.
Select the Repos that you want the alert rule to monitor for the matching alert condition.
In the Limit field, enter the maximum number of logs to retrieve using the entered Query.
Note
The Limit selection field disappears if you enter an aggregation query in the Query field.
Enter a Description.
Enter a Time-range of the alert.
Select Define Search Interval to apply a time interval to the search.
Enter the Search Interval in minutes. For example, if you set the search interval to two, Logpoint performs the search every two minutes. If you have used a pattern finding query in the Query field, the search is not performed in the specified Search Interval even if you select the Enable Search Interval checkbox as Search Intervals do not work with pattern finding.
Enable Delay Alert to define the delay threshold.
Enter the Delay Threshold in minutes. Logpoint waits until the delay threshold has passed before processing the logs, to ensure that all relevant logs are collected before generating the incidents.
Note
Delay Threshold can only be used with log_ts based searches. The col_ts based queries may not consider all logs while generating alerts due to log transmission and processing delays.
While defining Search Interval and Delay Threshold, we recommend you define the delay threshold in the multiple of the search interval.
The maximum value of the Delay Threshold can be up to 24 hours.
Check Flush On Trigger if you want the next alert to be triggered only by a new set of events.
Select Alert Throttling to ensure that multiple alerts are not created for the same set of values for a specified time.
Enter the Field and the time in Minutes. Once an alert is triggered for a value of the particular Field, it does not trigger another alert for the same value specified in Minutes.
Click Next.
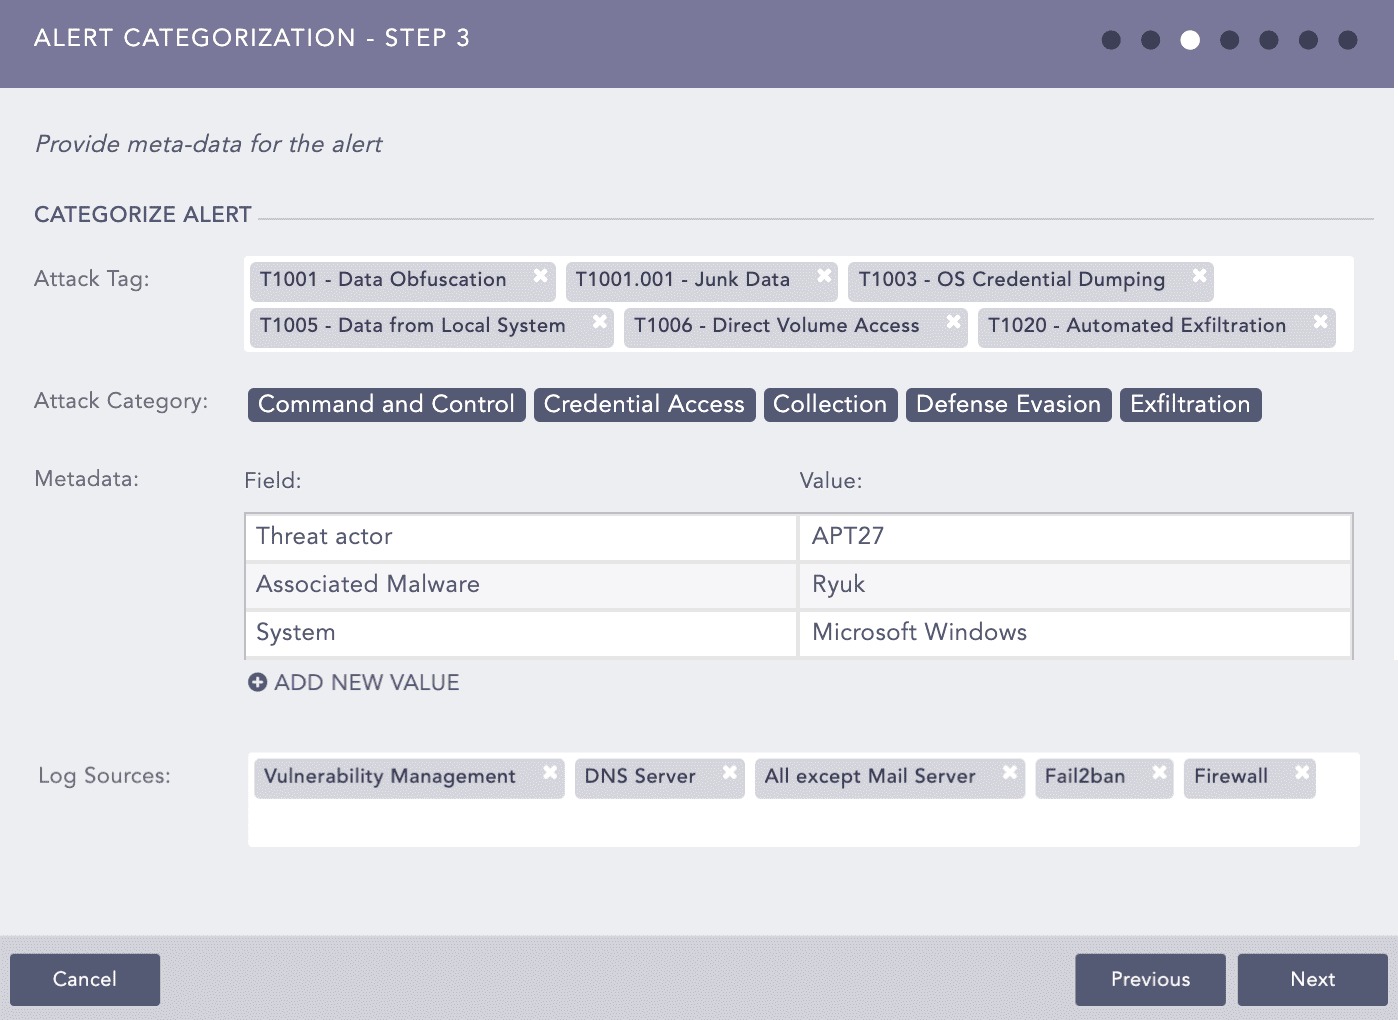
Select the Attack Tag from the drop-down. You can select multiple tags to categorize the alert.
Attack Category is selected based on the associated Attack Tags selected.
To categorize the alert rule, use both Field and Value to add metadata to the alert rule.
You can use letters, numbers, underscores (_), or a combination. Always start with a letter.
You can add as many metadata rows as you like. Click ADD NEW VALUE.
You cannott use the same Field name for two different values.
You cannot use Logpoint Jinja placeholders as categorization metadata. Go to Logpoint Reserved Jinja Placeholders to learn more.
Select Log Sources from the drop-down or enter new log sources associated with the alert rule. New log sources are also updated in the drop-down after submission.
Click Next.
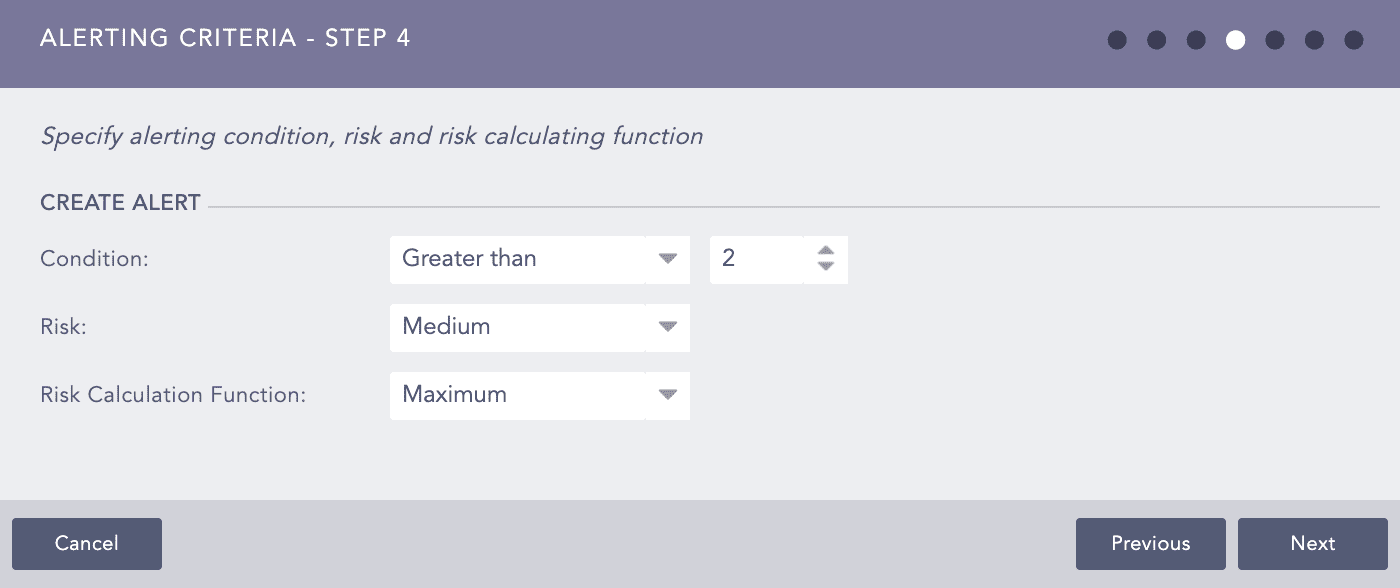
Select the Condition, Risk, and Risk Calculating Function from the drop-downs.
Based on the Risk level and Risk Calculation Function, Logpoint calculates the Risk Value of the alerts and incidents they generated. If the search result of the query contains the device_ip, the Risk Calculation Function takes the Risk Value of the devices and Risk level of the alert as arguments.
For example:
If the Risk level of an alert is Medium, Risk Calculation Function is Maximum, and the Risk Value of its associated device(s) is Critical, the Risk Value of the generated alert and incident is: Maximum(Risk level, Risk value of device(s)). That means the Risk value of the incident is Critical.
The risk value of a device is calculated from the values of Confidentiality, Availability, and Integrity.
Whereas for search queries with pipeline commands or without device_ip in the search results, the Risk Value of the alert and its generated incident(s) is equal to the Risk level of the alert.
Note
Condition is the number of logs the search will return. Setting a limit controls the number of logs for the search. The number of logs you select should not exceed the previously set limit. Logpoint compares the limit value to the value set in the condition to the added alert rule. For example, you set the limit to 30 logs. Then you need to make sure that your condition is 30 or less. It cannot be greater than 30.
Average returns the average of the sum of Confidentiality, Availability, Integrity, and Risk divided by the number of times they happened. Maximum returns the highest value and Minimum returns the lowest.
Click Next.
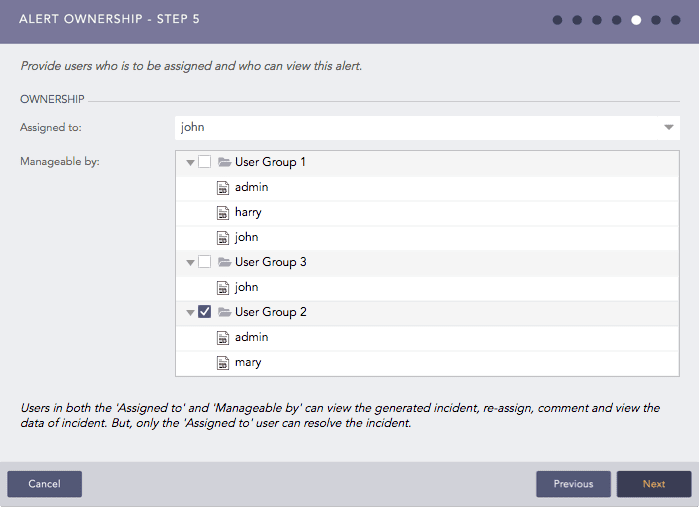
If required, you can assign an Alert Rule to an individual Logpoint user by selecting none of the Incident User Groups in the Manageable by tree node structure. For more information on Incident User Groups, refer to the Incident User Groups in Logpoint.
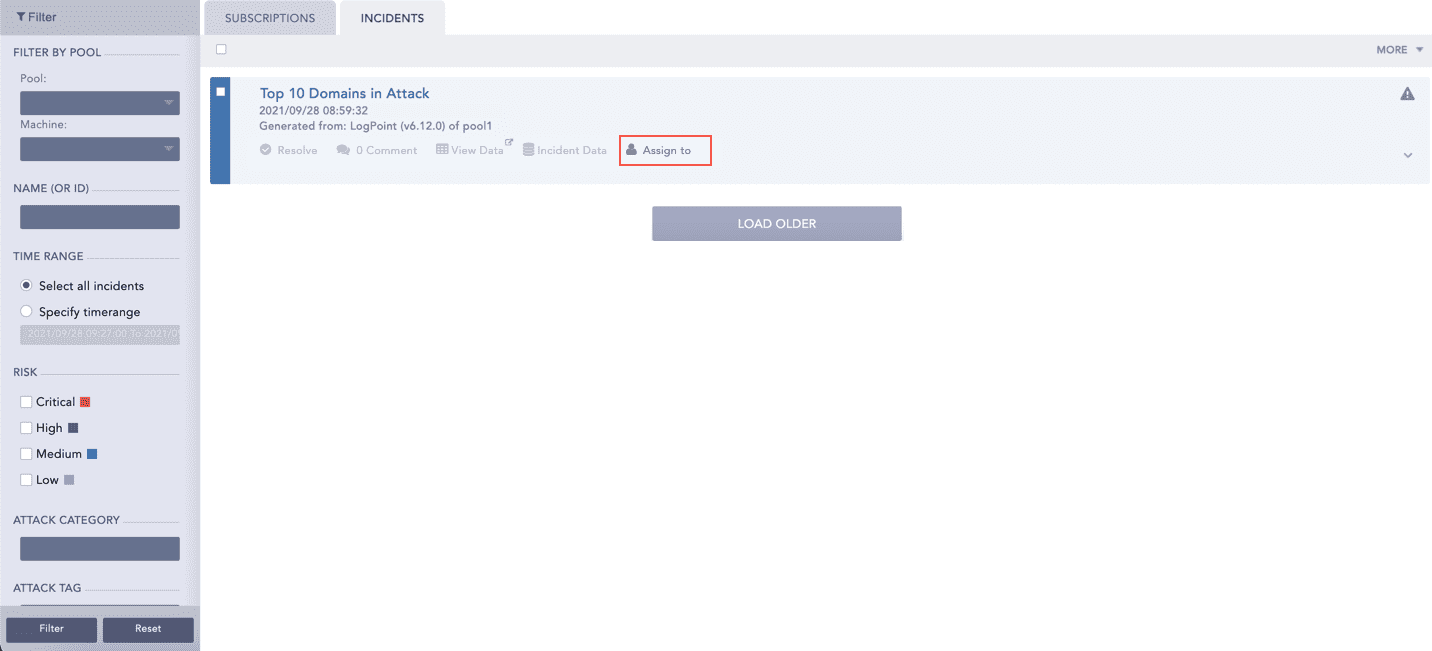
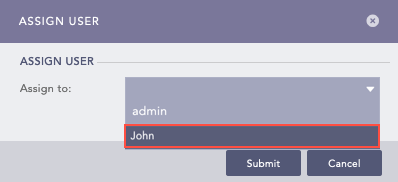
Select a user from the Assigned to drop-down. You need to assign the Alert rule to a user or user group. To select an individual user, select them in Assigned to. You can assign an Alert Rule to yourself by deselecting all of the Incident User Groups in Manageable by.
To assign the alert rule to a group, select the group in Manageable by.
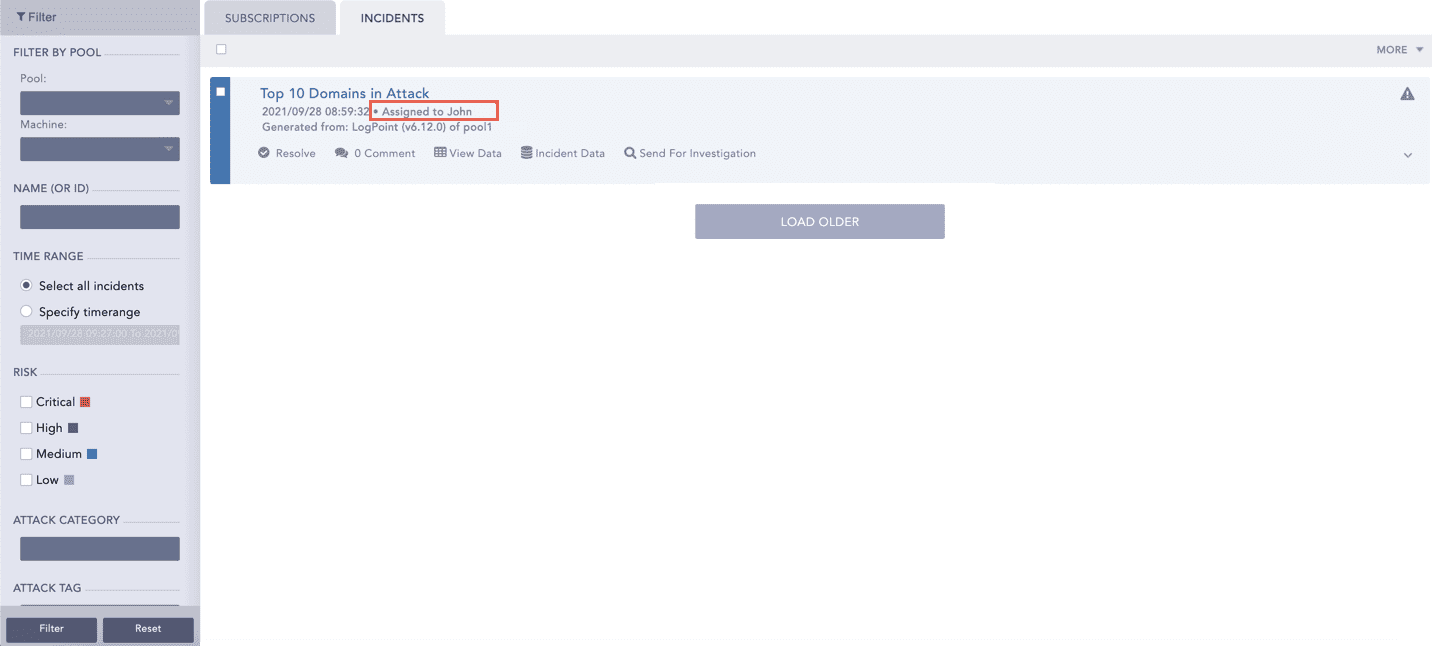
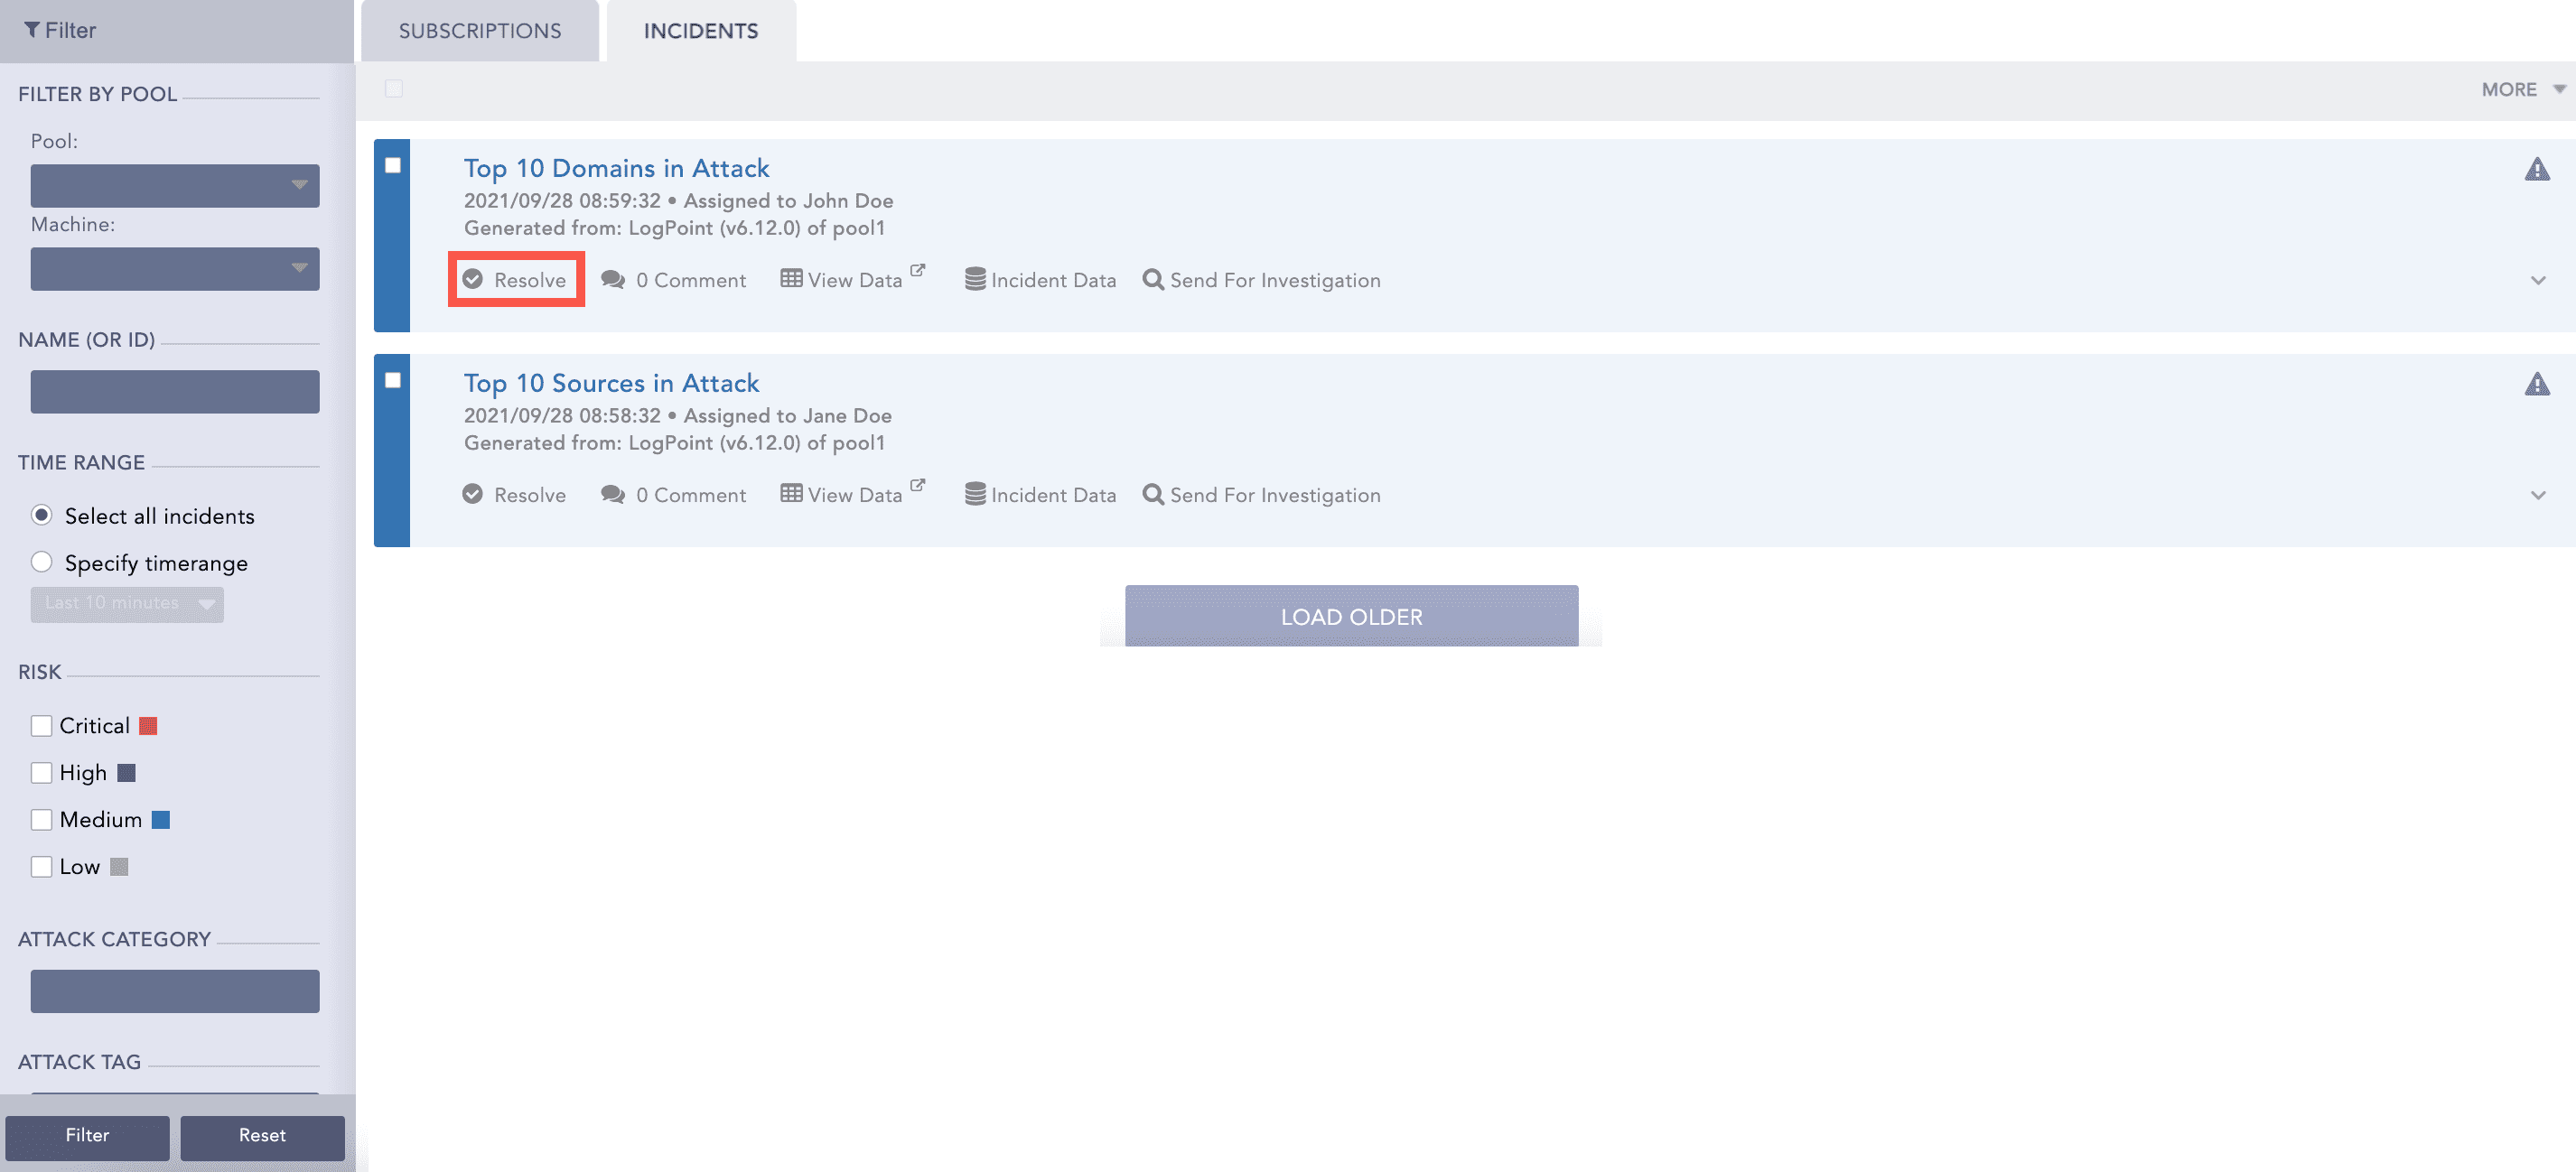
Users selected in both the Assigned to and Manageable by section can re-assign, comment on and view the data of the generated incident. However, only the Assigned to user can resolve it.
Note
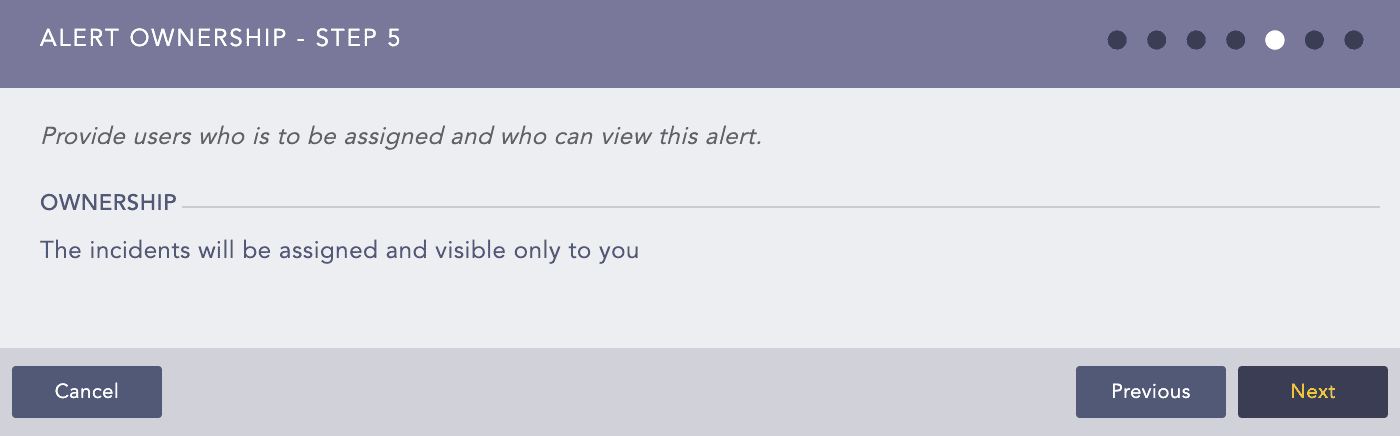
If you do not belong to any of the Incident User Groups, the Assigned to and Manageable by are hidden and in LPSM you get the following:
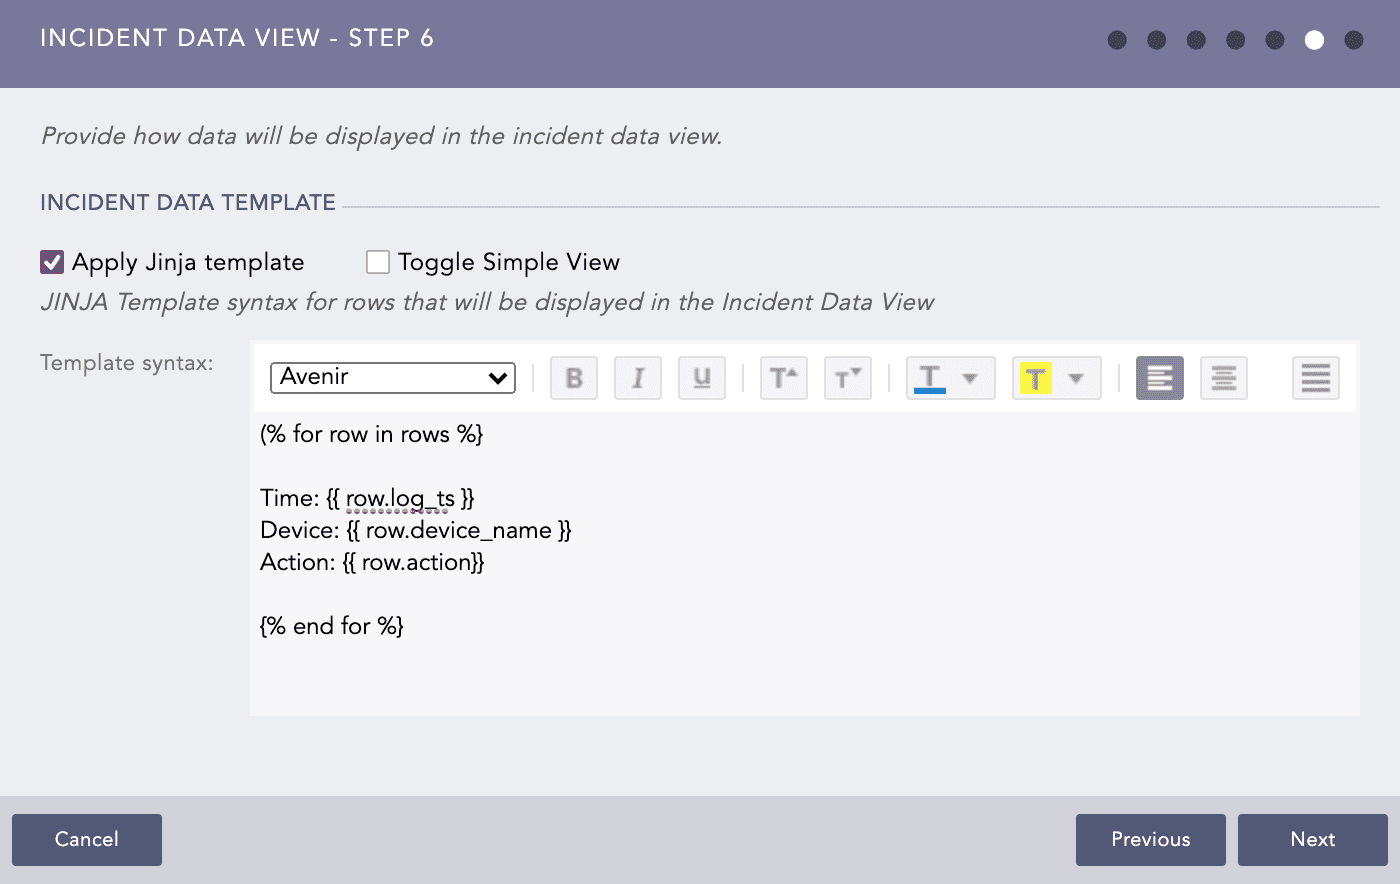
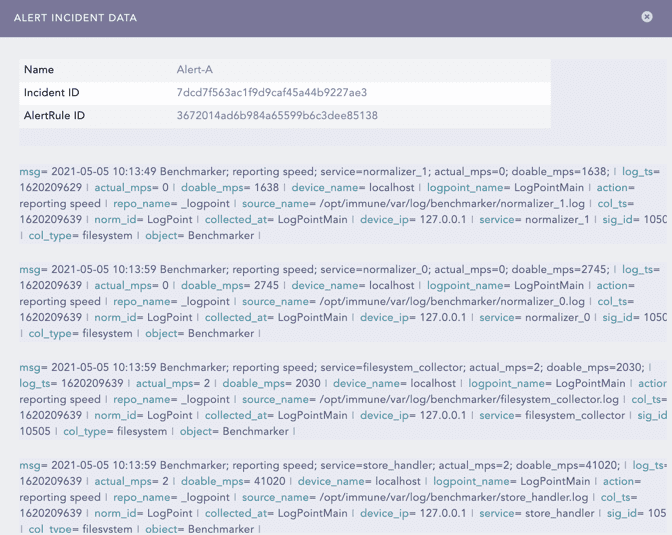
LPSM allows you to view the details of the incidents triggering the alert in a specific format. Enable Apply Jinja template and enter the template in the Template syntax field.
Note
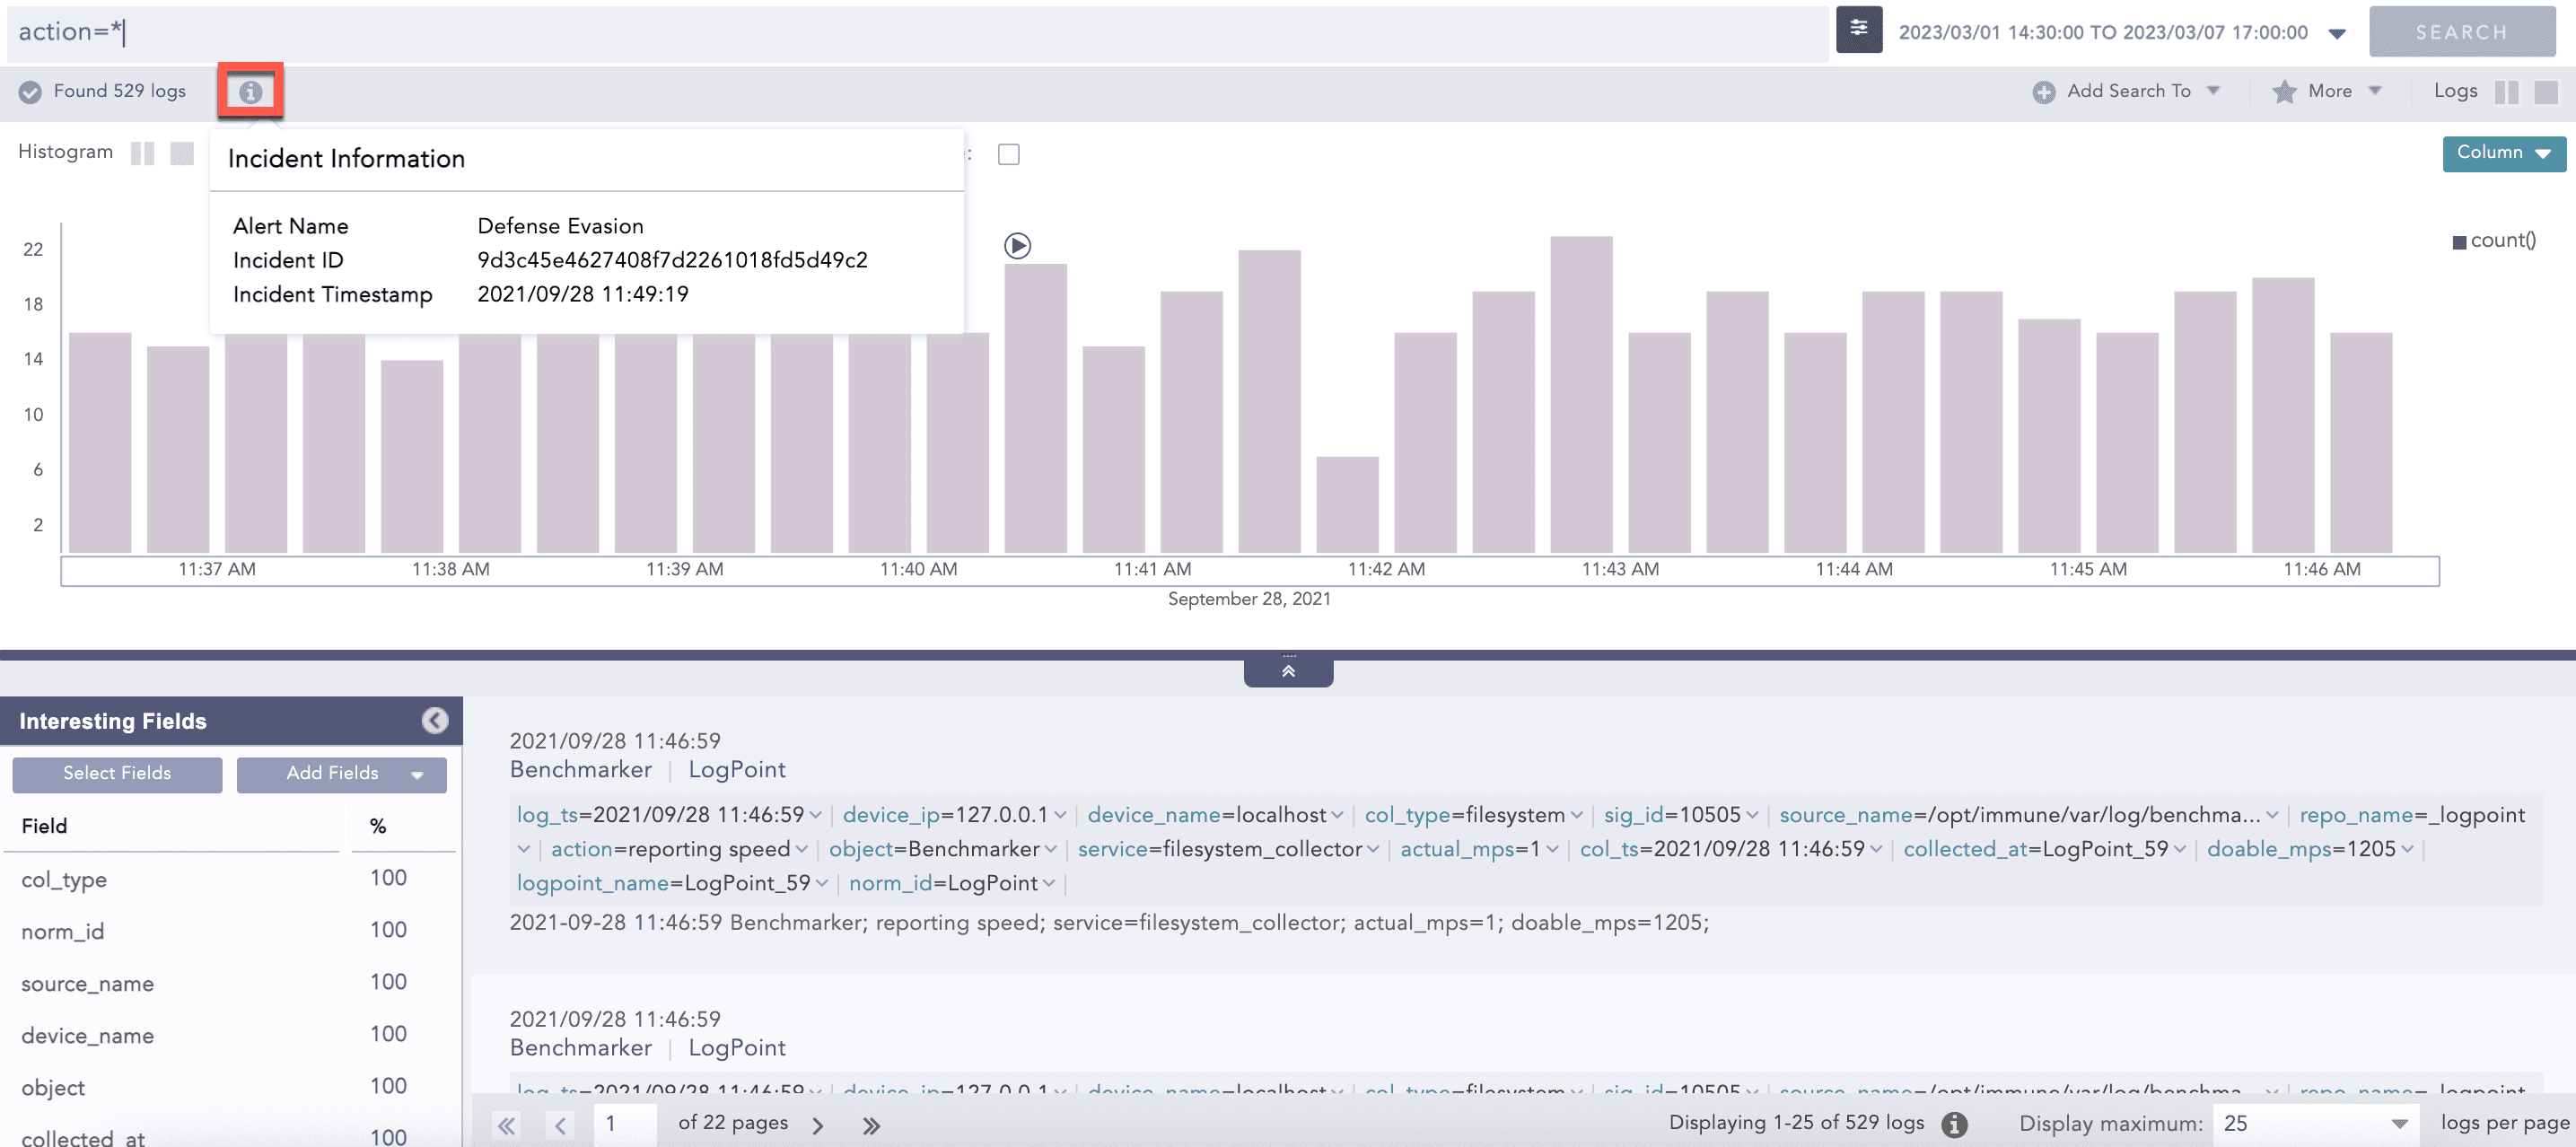
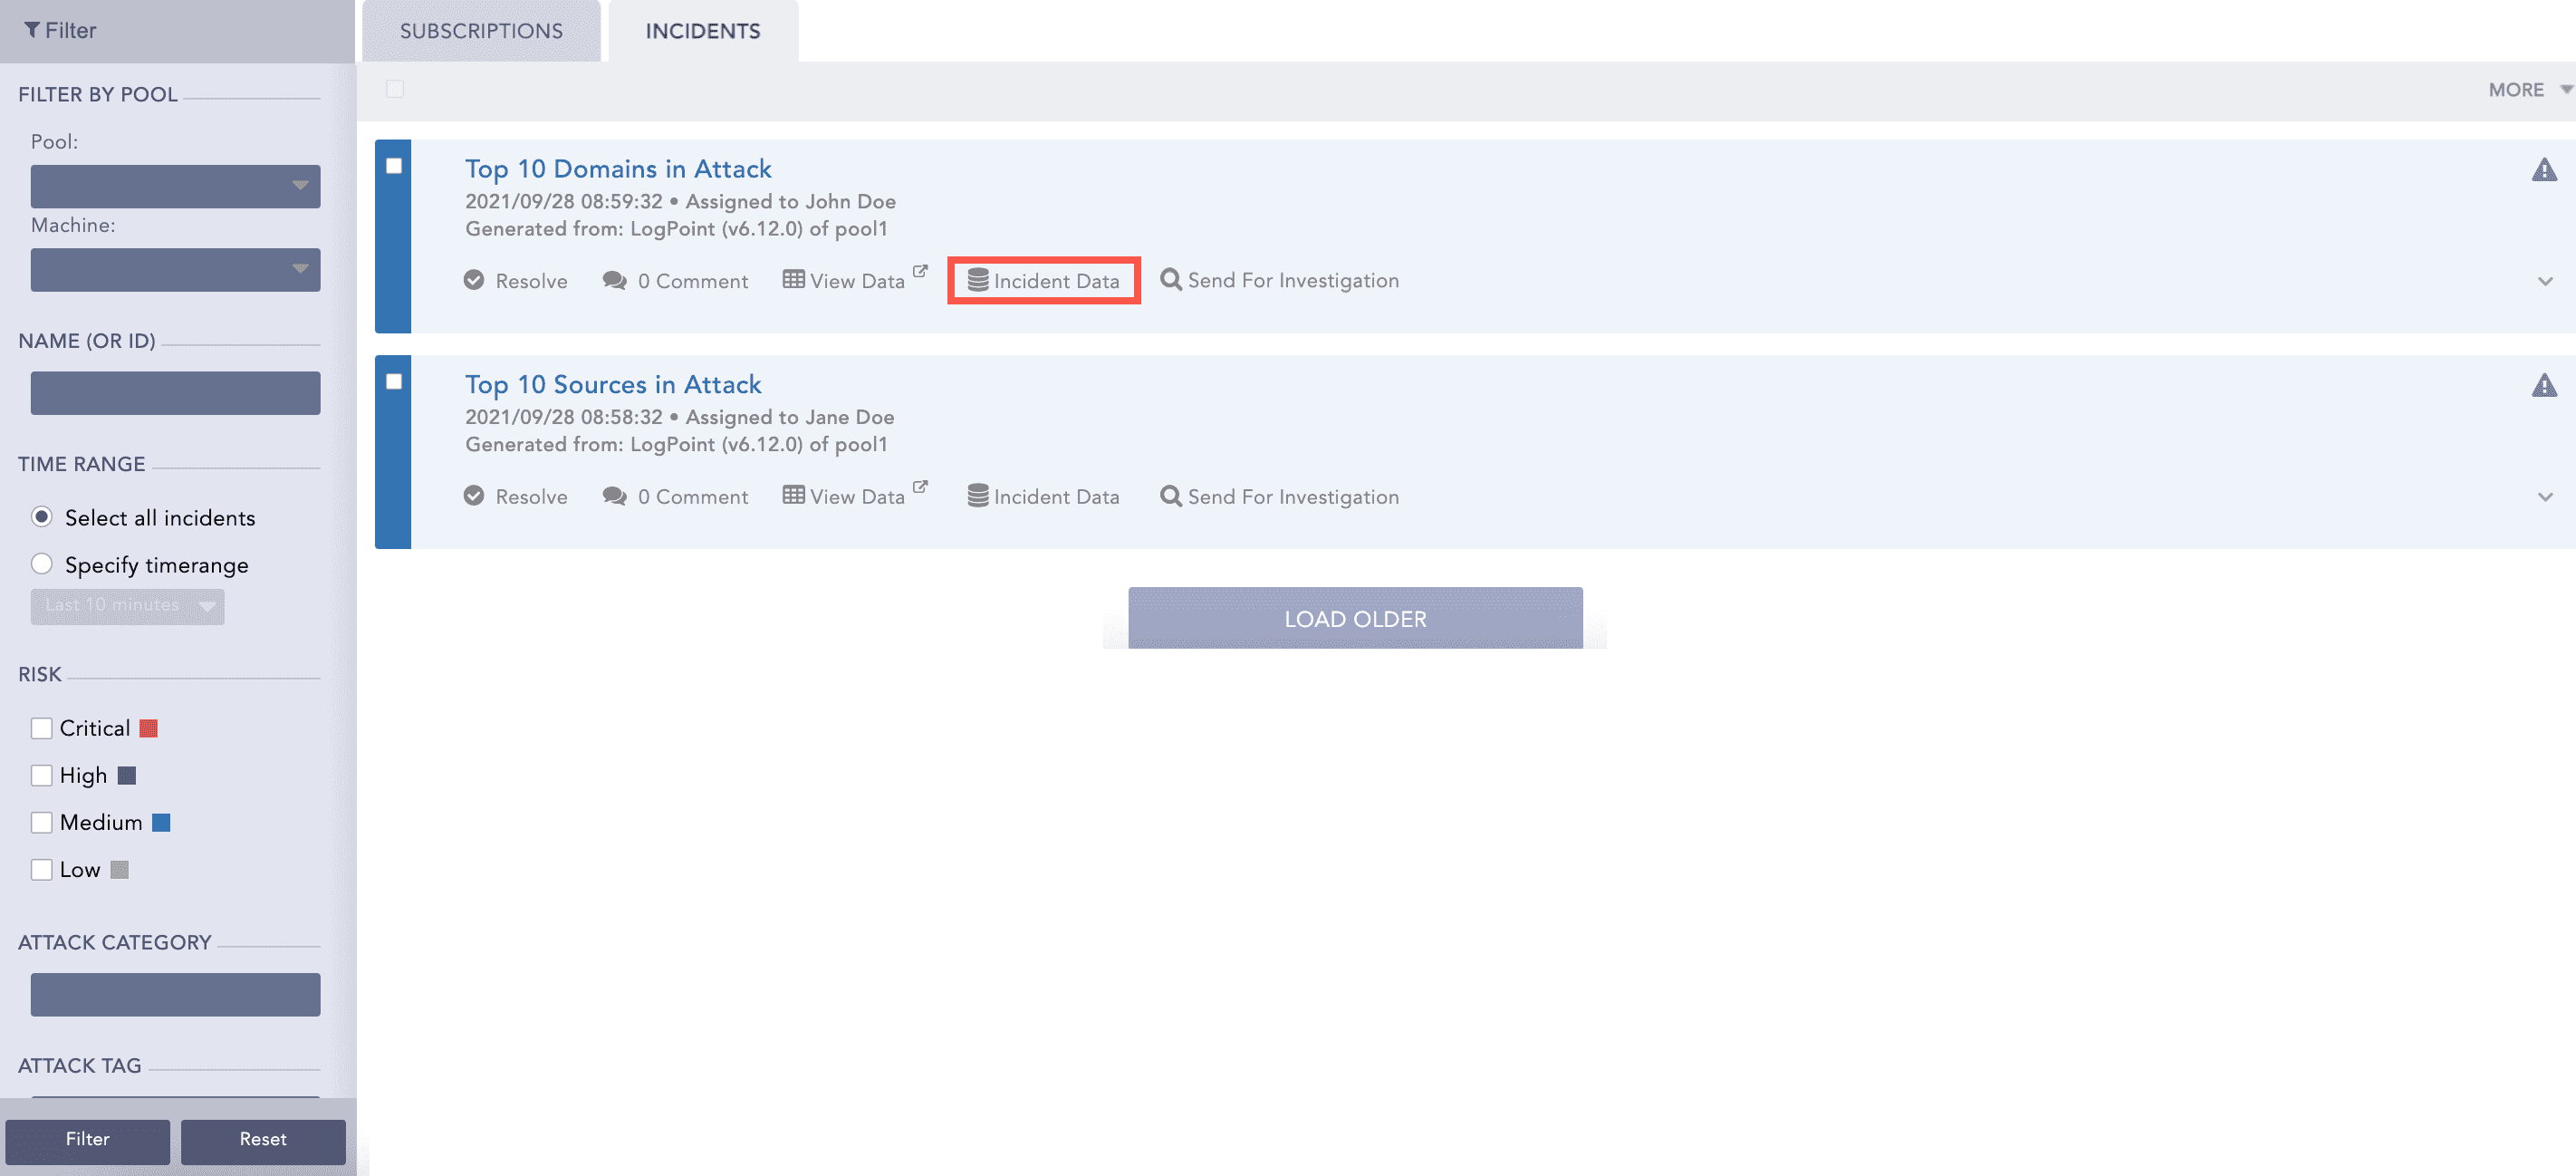
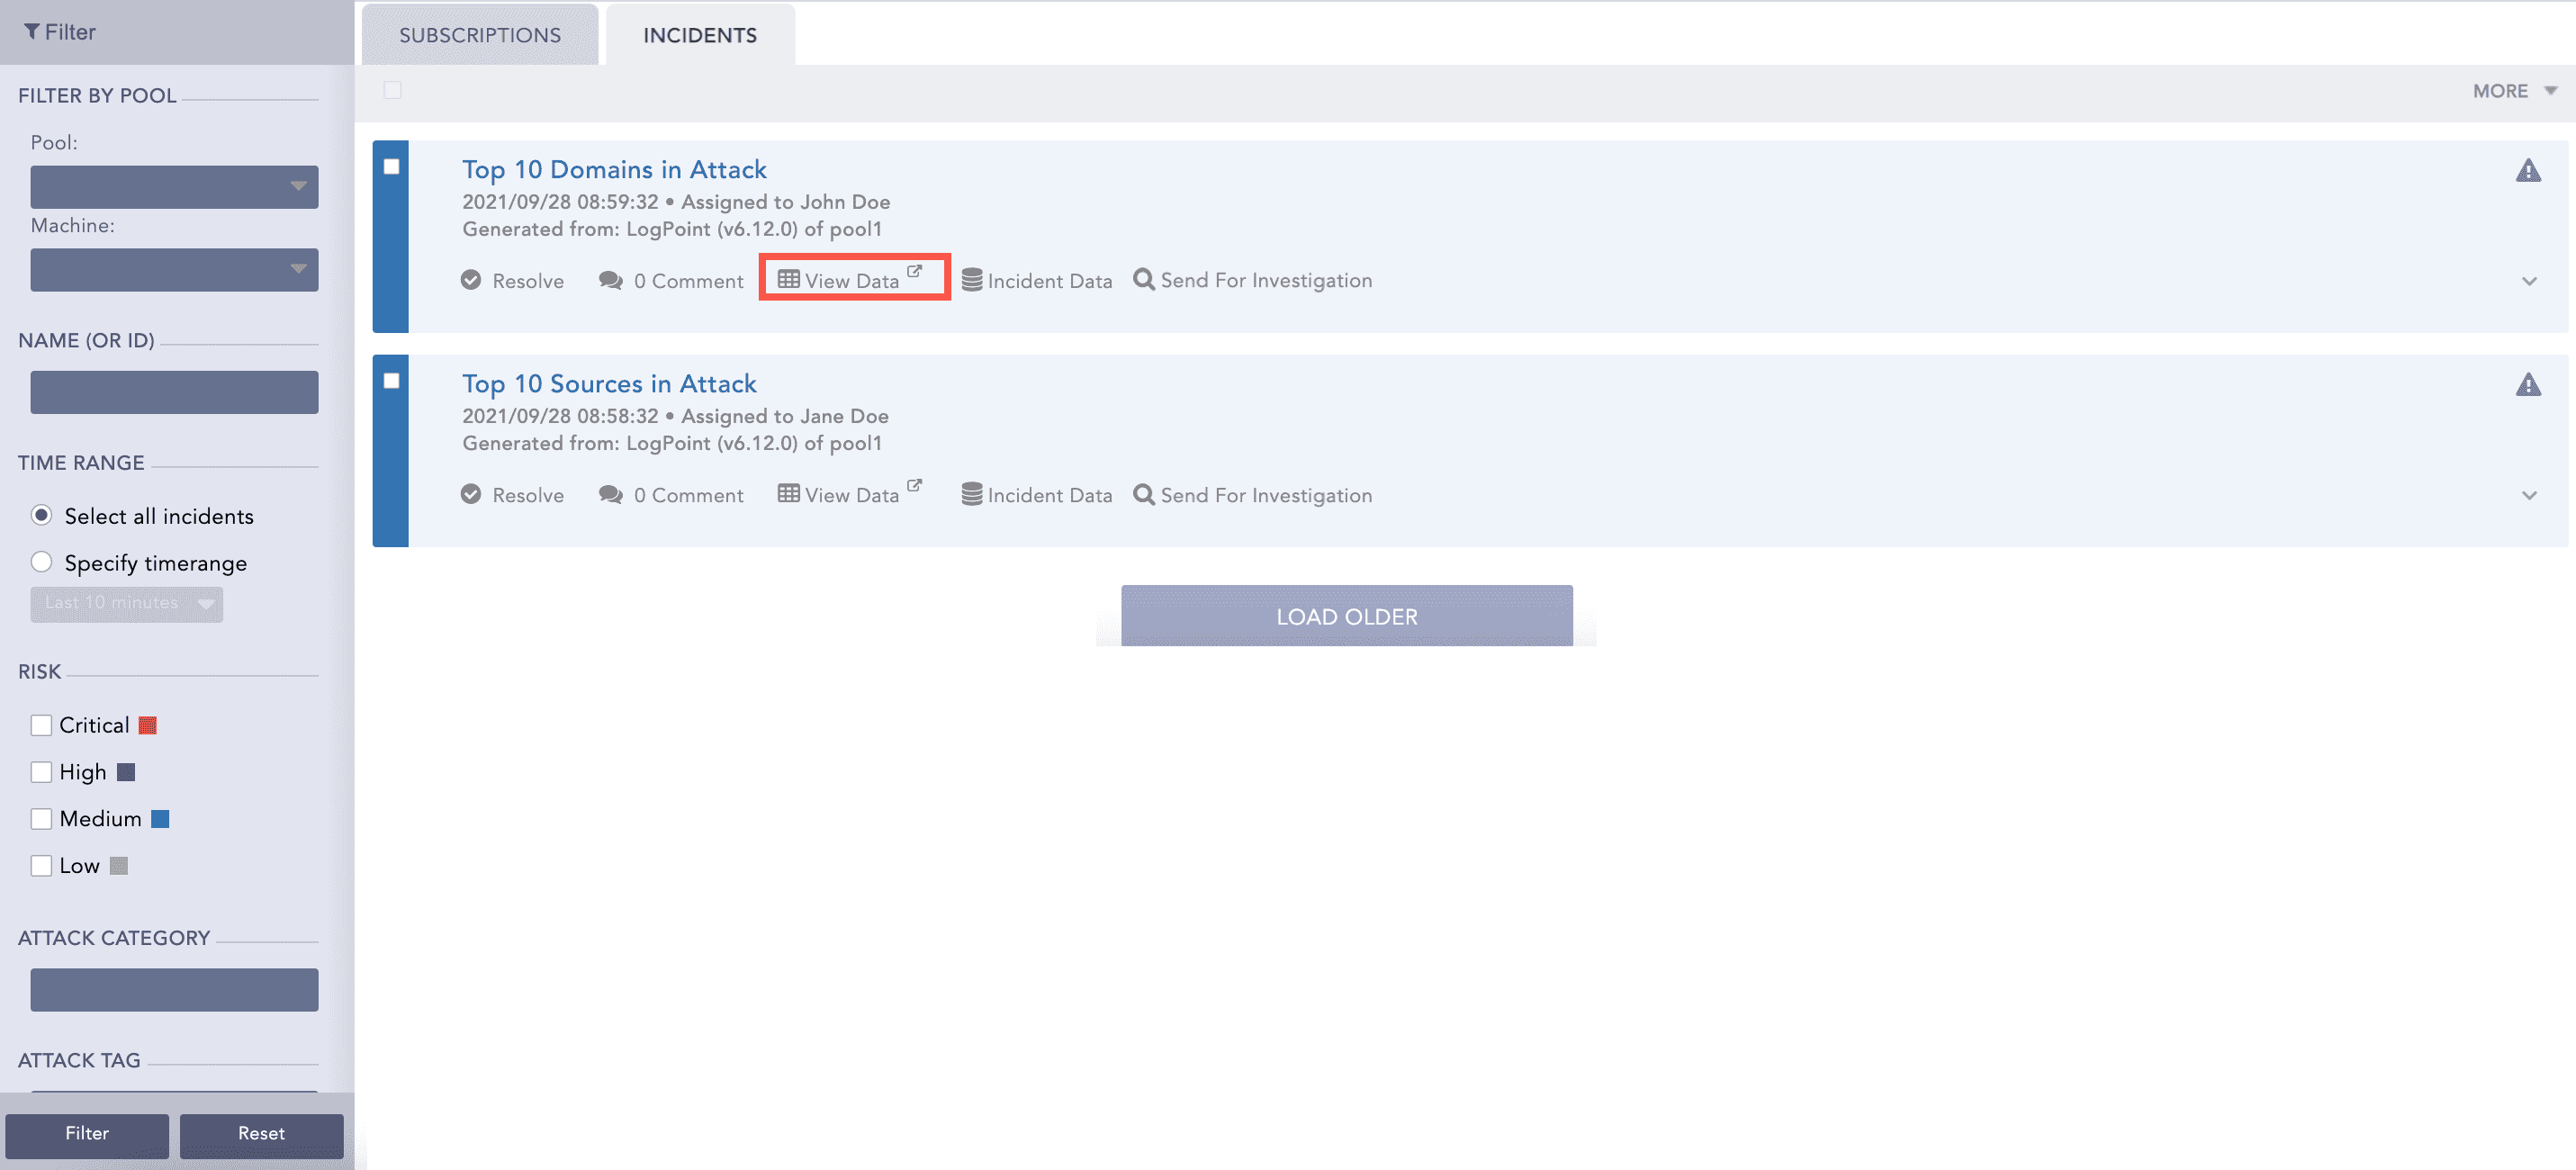
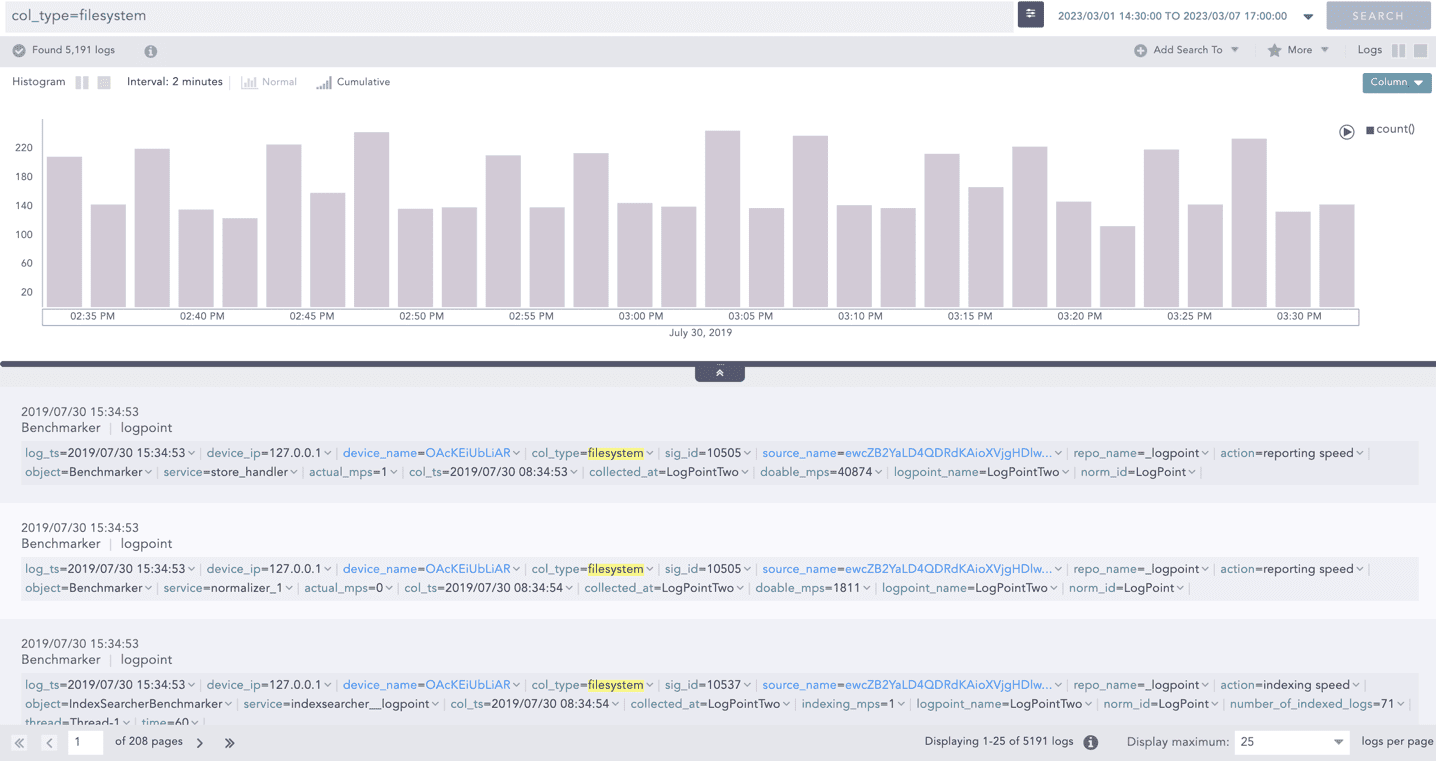
To view the details of the incident in the specified Jinja format, click the Incident Data icon of the incident generated by the alert rule.
While including timestamp data in the Jinja template, it is mandatory to include the datetime filter. The timestamp is displayed in raw epoch format if the datetime filter is not included.
Select Toggle Simple View to enable or disable the advanced text editor.
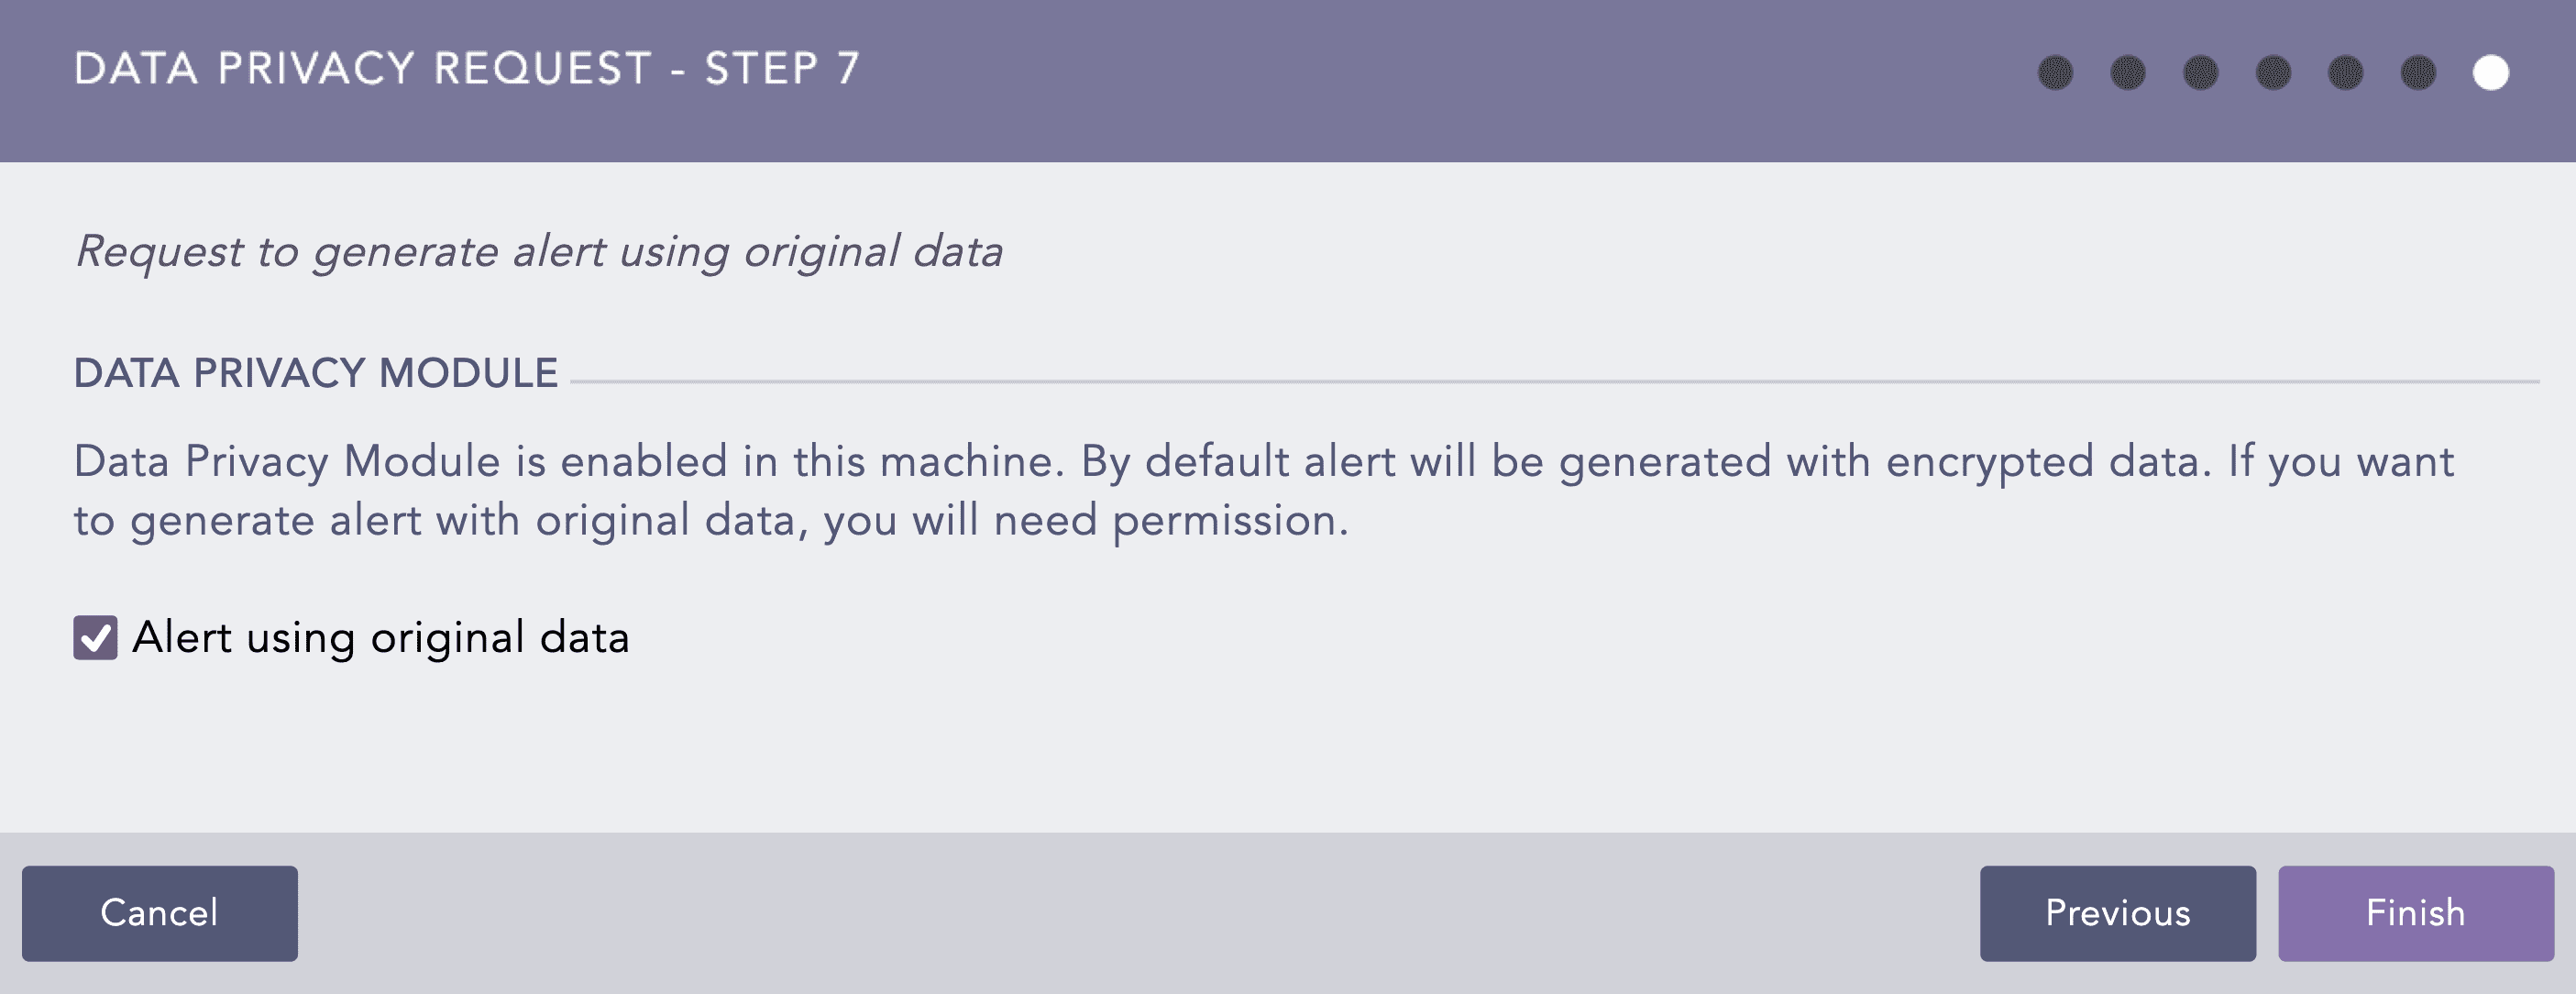
If the Data Privacy Module is enabled in the system, the Data Privacy Request window will appear. Check the Alert using original data option if you want the fields in the alert to be decrypted, else, the alert will be generated with encrypted values.
Click Finish.
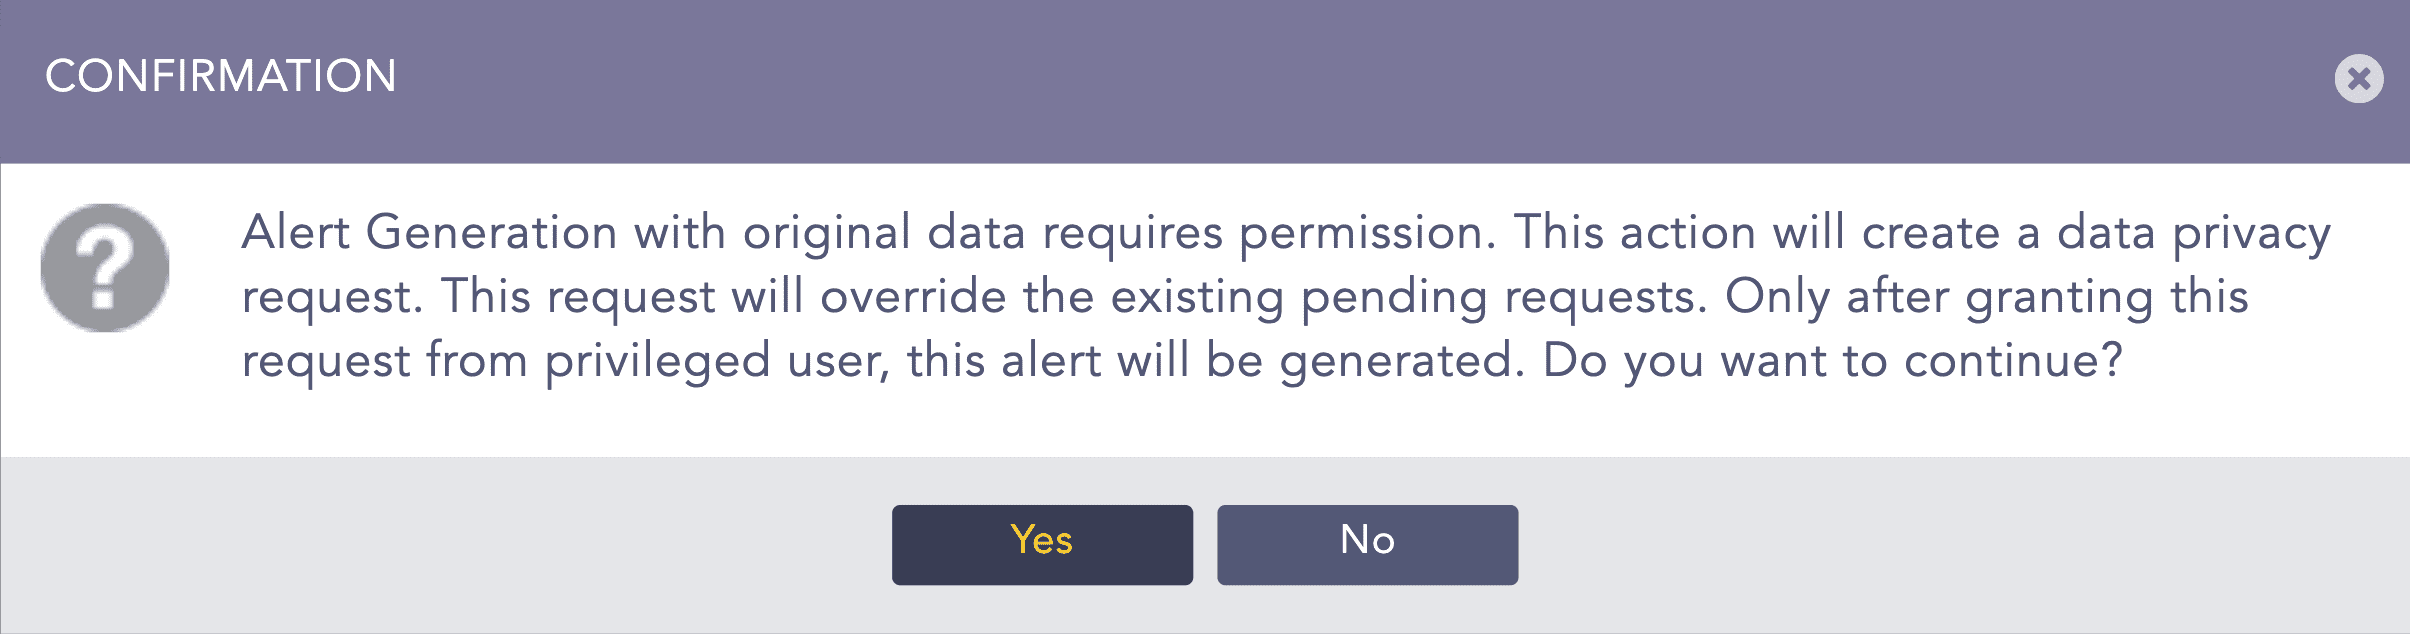
If you have checked the Alert using original data option, you will be notified with a confirmation message. Click Yes to create a data privacy request for the alert. The alert created hereby will be deactivated until the data privacy request is granted.
Note
Alert Rules can be exported as per your requirement. However, the ownership information will be lost while exporting the Alert Rule. This behavior is also observed while using the Shared and Cloned Alert Rule.
In the Data Privacy Module enabled systems, after successfully configuring the settings for the alert by the users with Can Request Access, the users with Can Grant Access privilege will be prompted with a message regarding the request. This can be viewed under Settings >> Configuration >> Data Privacy Module >> Pending Request.
Similarly, after the request is granted, the users with Can Request Access will be prompted with a message, which can be viewed under Settings >> Configuration >> Data Privacy Module >> Request. Only then will the users be able to view the alert with original data.
After completing the configuration, LPSM shows you a notification dialog box asking whether you want to configure the notifications for the rule. Click Yes. Once the alert is created, you can view it under My Rules. The alert is also created in the Fabric-enabled Logpoint.
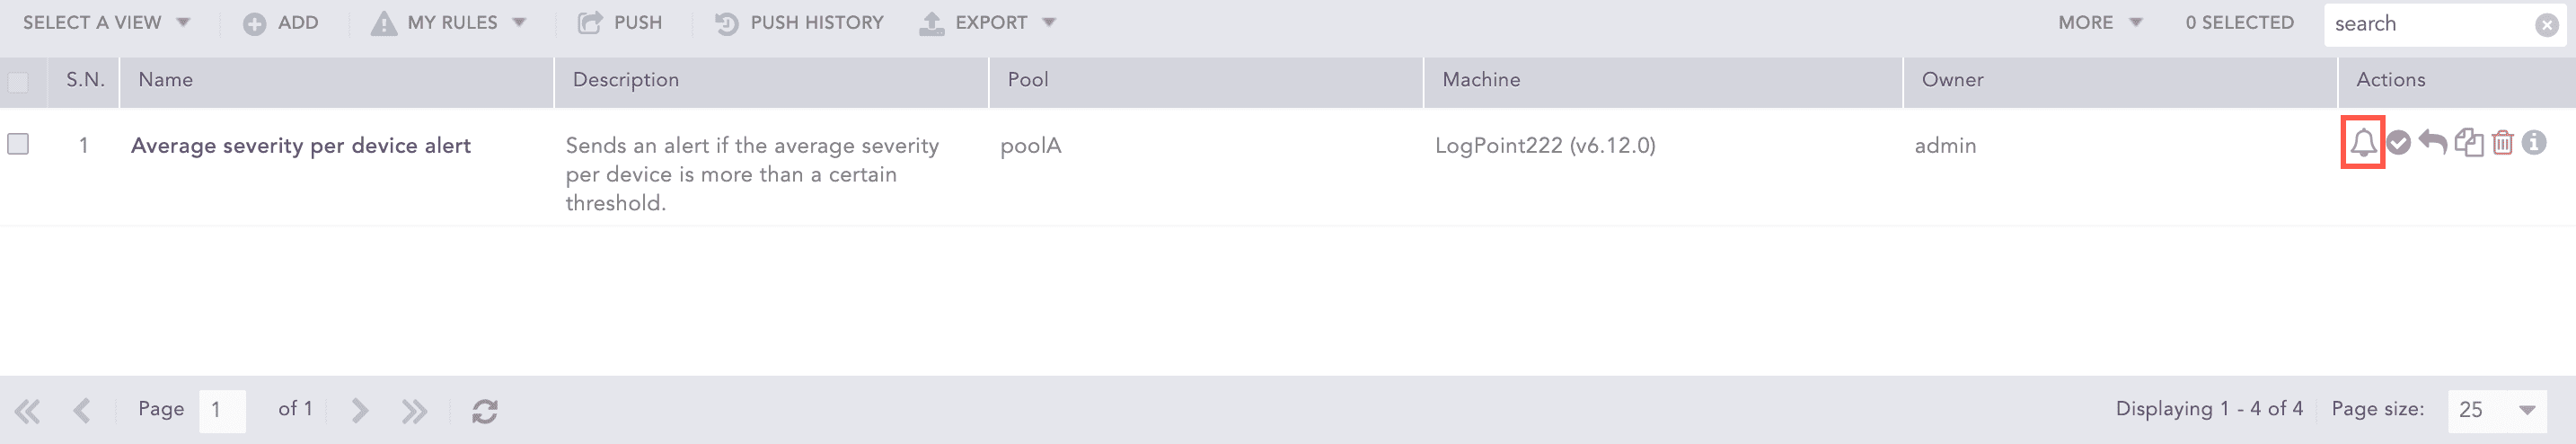
You can also configure or change it later by clicking the Notification icon from the Actions column of the alert rule.
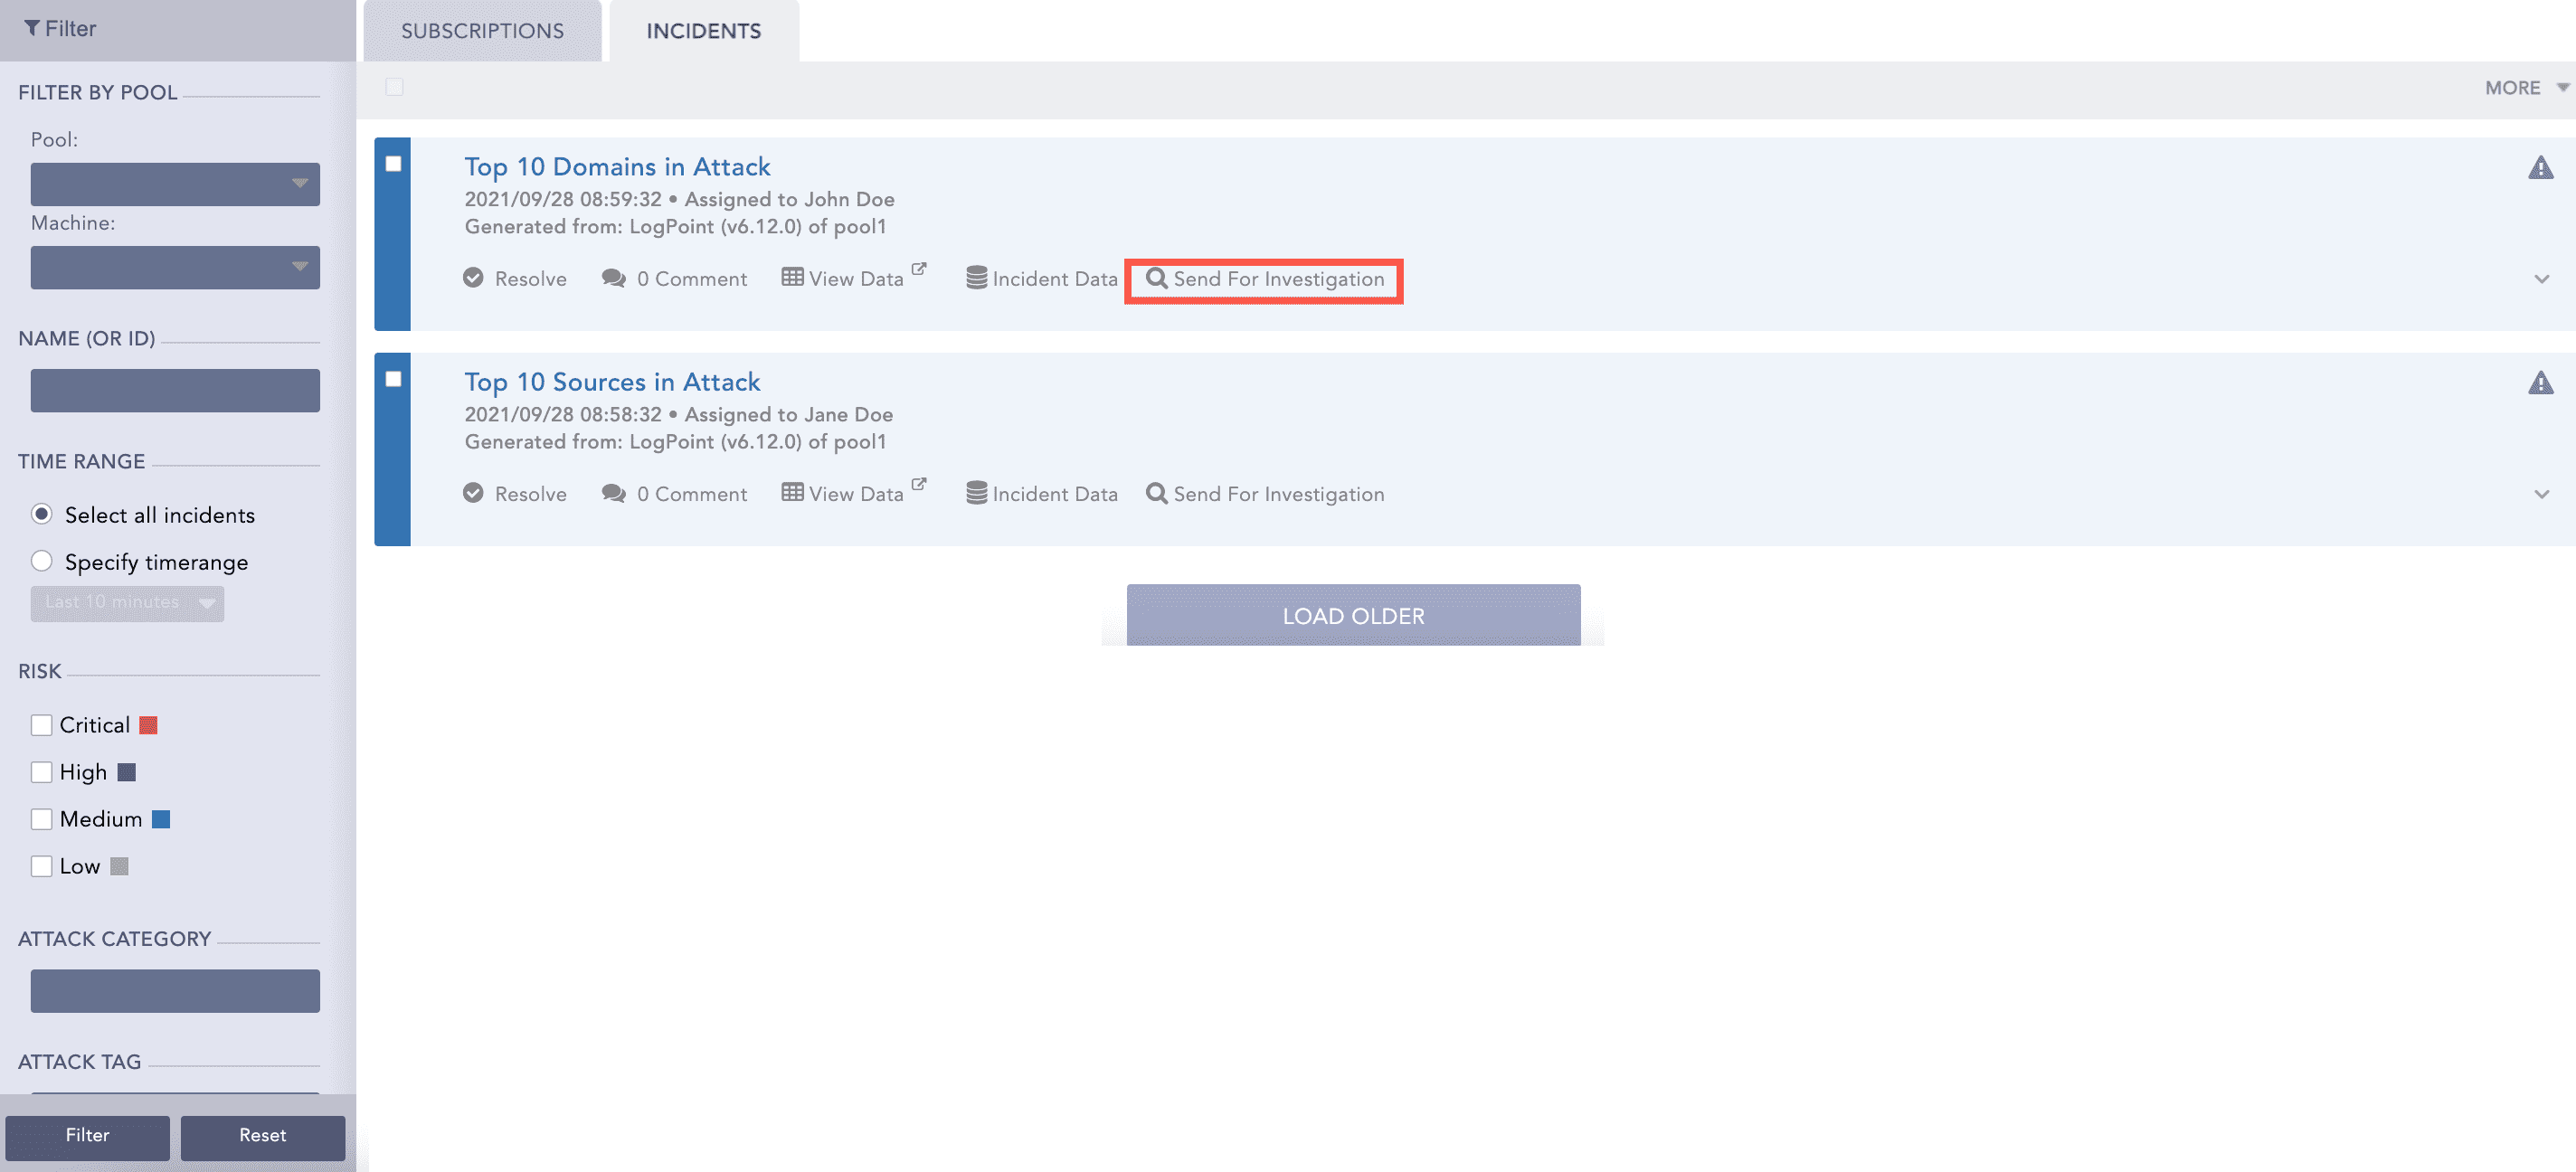
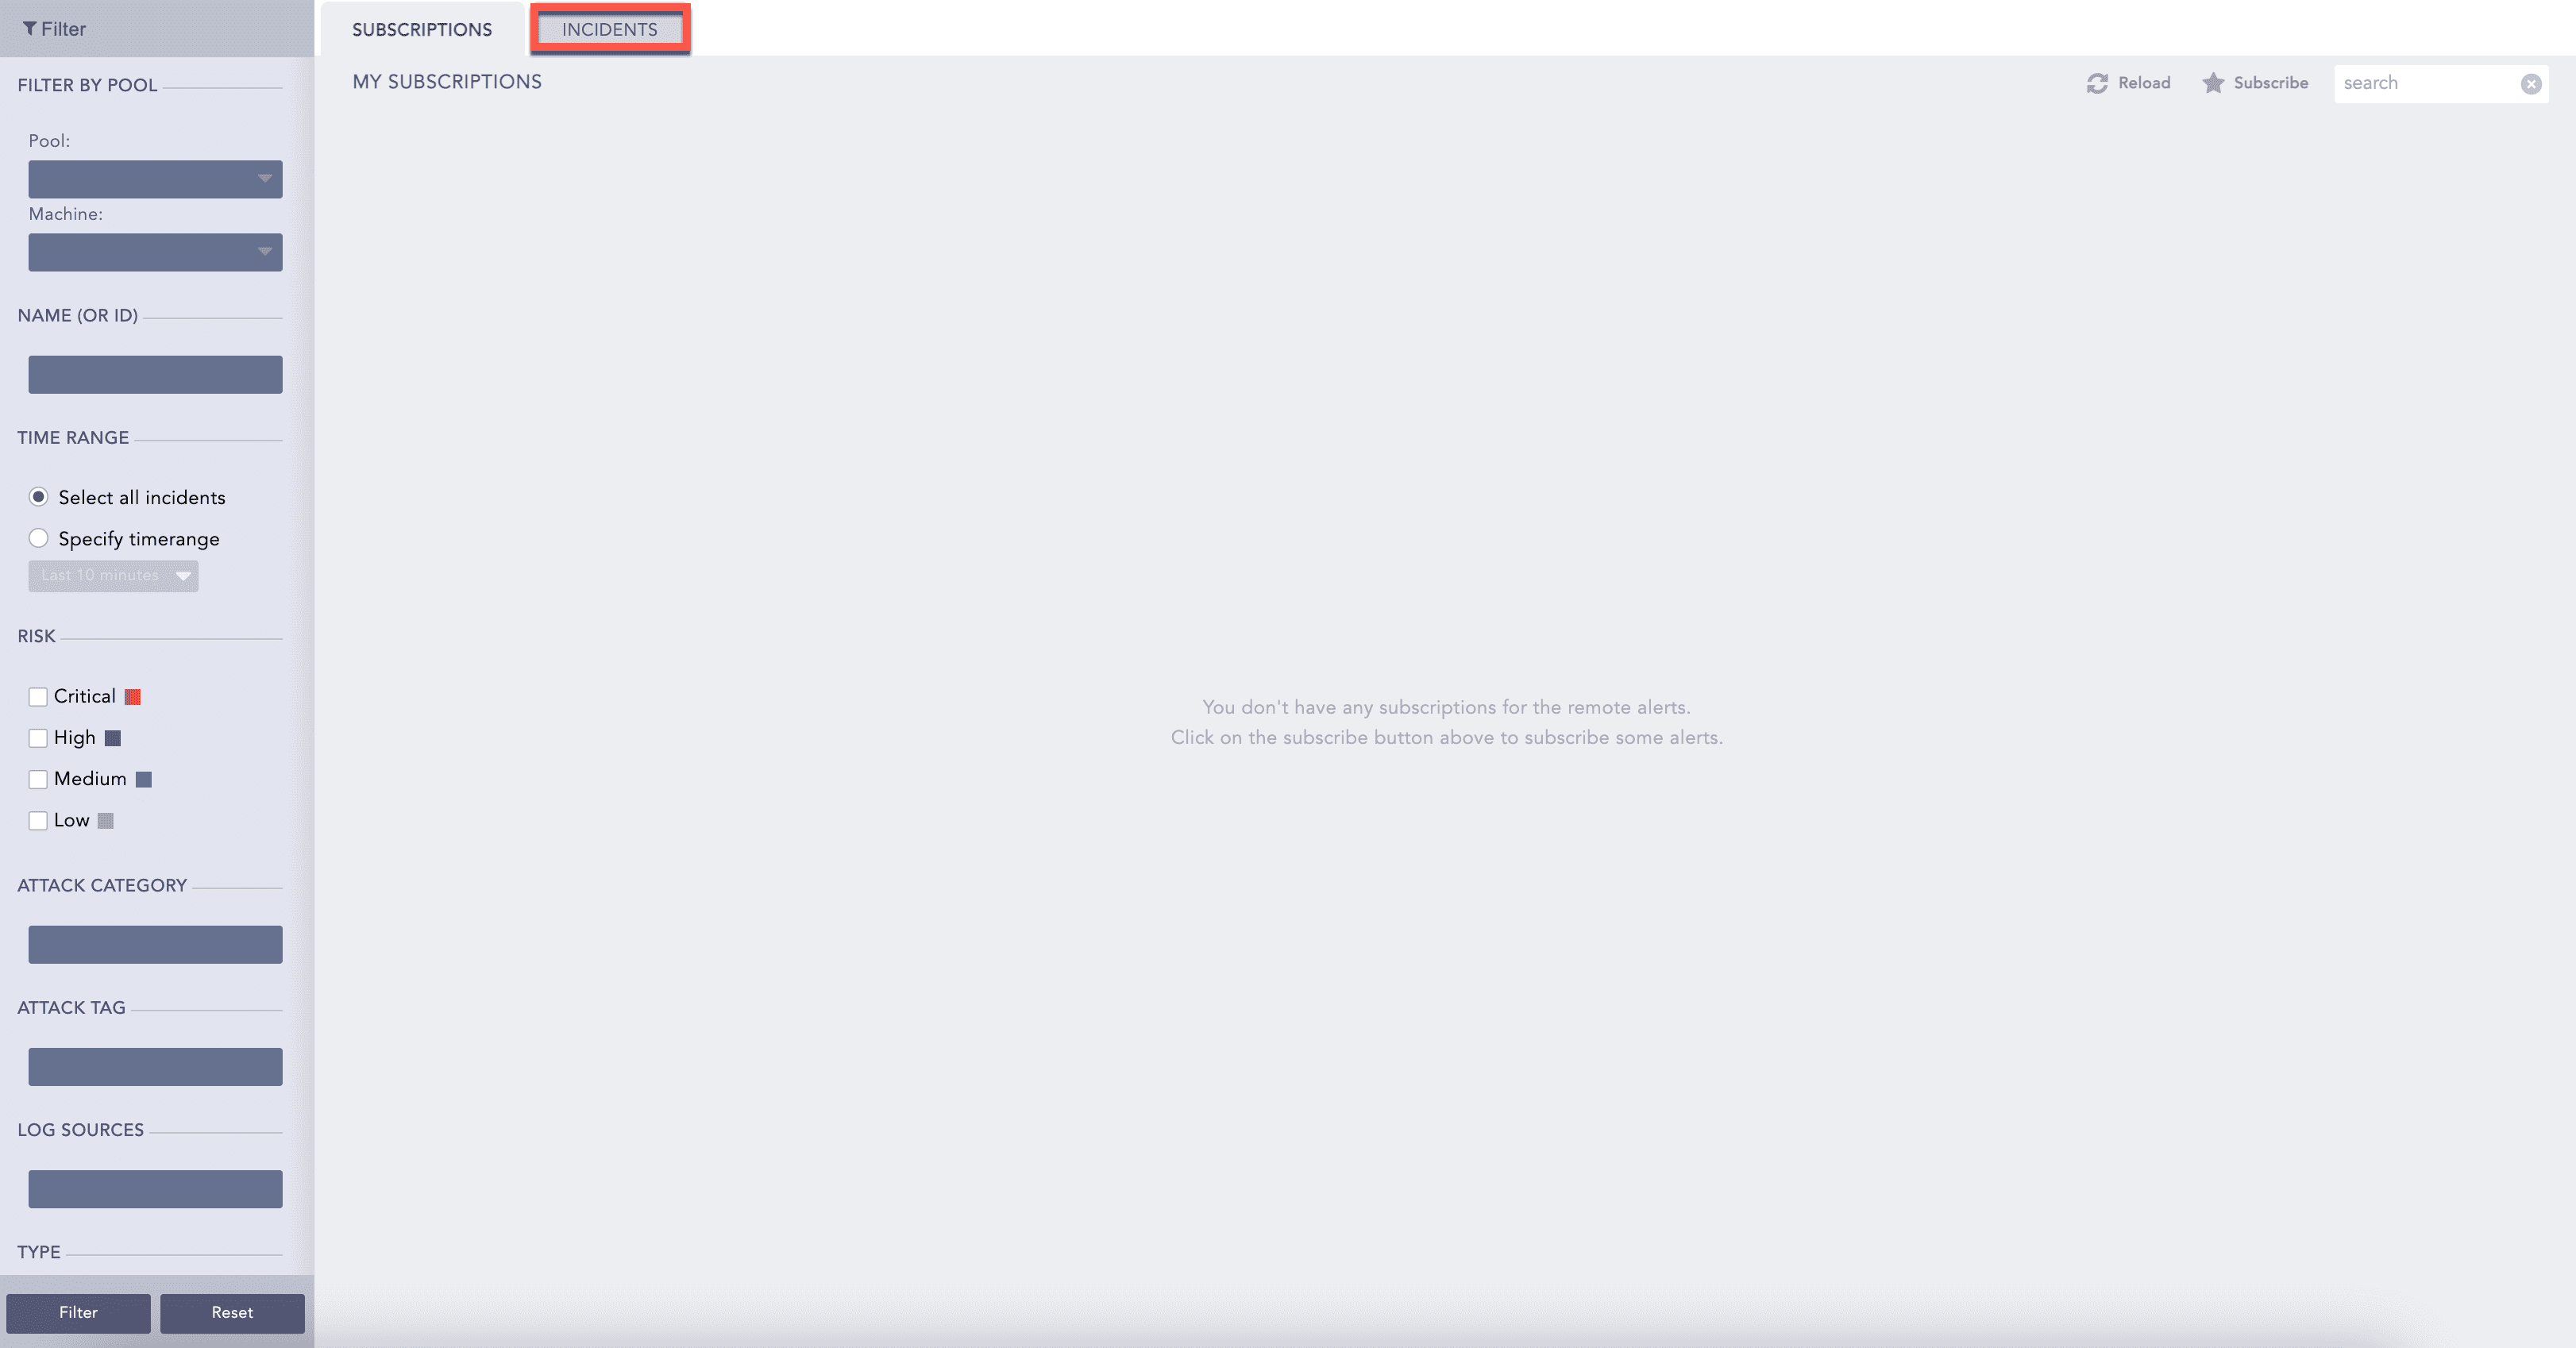
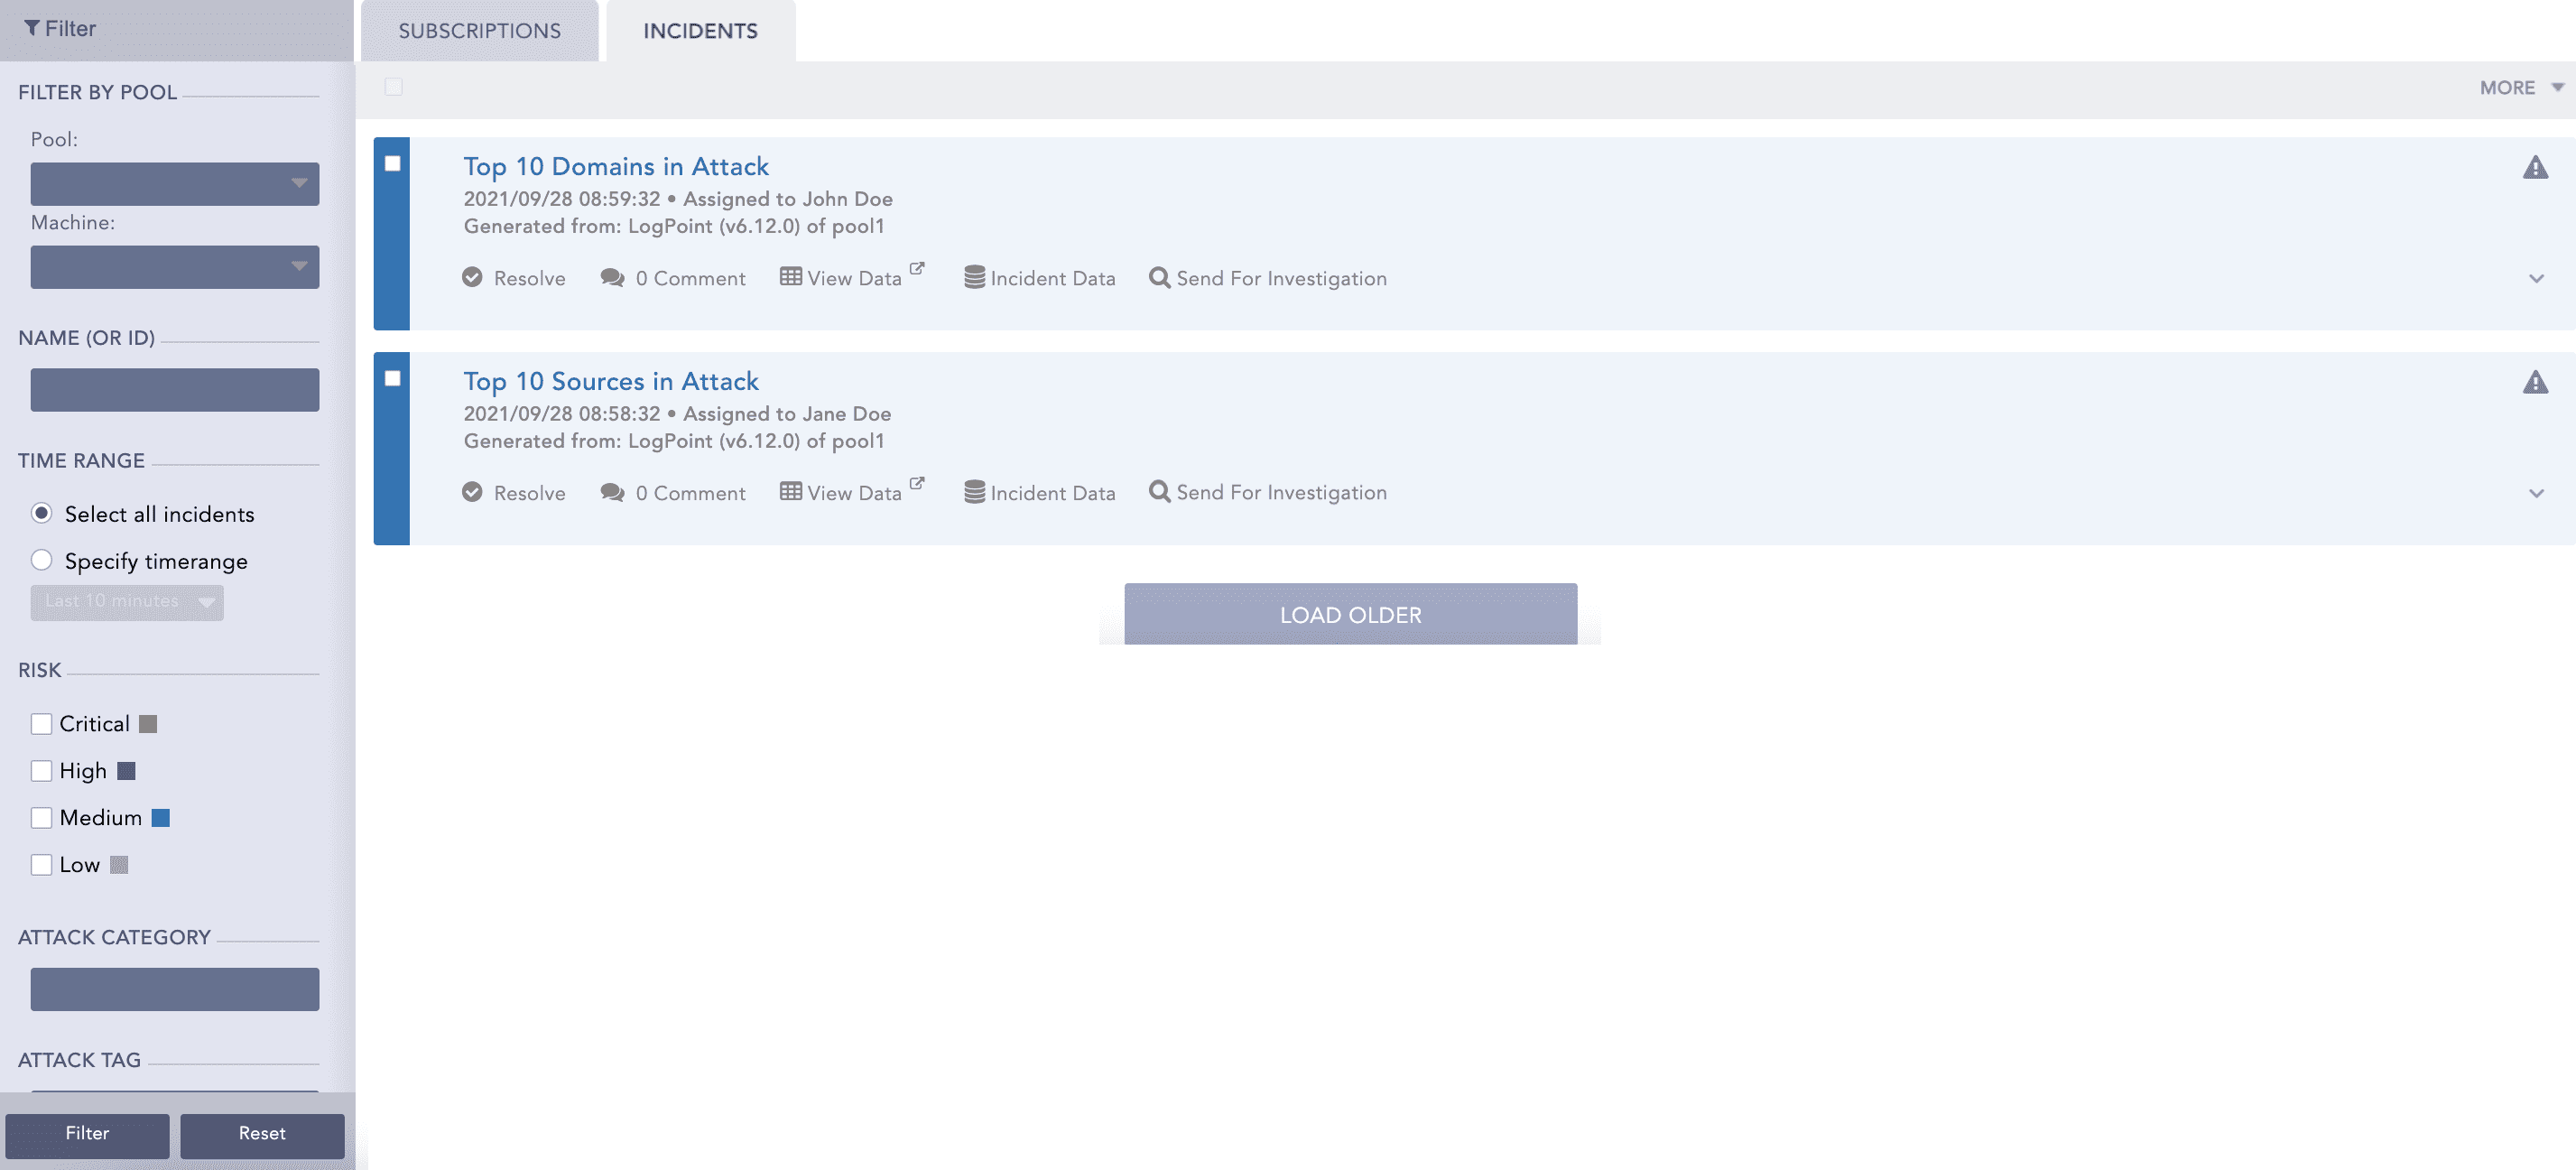
Now, whenever a search query meets all the alerting criteria, the alert is triggered, and it generates the corresponding incident. To view the incident, click the Incident tab.
Setting Up Alert Notifications
After creating an alert rule on behalf of a Fabric-enabled Logpoint, you can set up the following notifications for the rule.
Email notification
SMS notification
Syslog notification
SNMP notification
HTTP notification
SSH notification
The message and command fields of the SMTP and SSH notifications support Jinja2 syntax. The message field of the Syslog notification supports Jinja syntax. For more information on how Jinja and Jinja2 syntaxes are implemented in the SMTP, SSH, and Syslog services, go to Setting Up Alert Notifications in Logpoint Alerts and Incidents.
In LPSM v2.2.0 and later, you can
Use the {{lpsm_search_link}} Jinja command to display the link to search for the logs that triggered the alert.
In Fabric-enabled Logpoint, the link redirects you to the LPSM search page.
In standard Logpoint, it redirects you to the Logpoint search page.
To use this Jinja command, Server Alias in System Settings >> General must be selected and a valid value specified. be empty and specified.
For more information on supported Jinja syntax for alert notification setup, go to Logpoint Reserved Jinja Placeholders in Logpoint Alerts and Incidents.
Configuring Email Notification
Go to Settings >> Logpoint Configuration >> Alert Rules.
Click the Setup Notification icon from the Actions column of the alert rule.
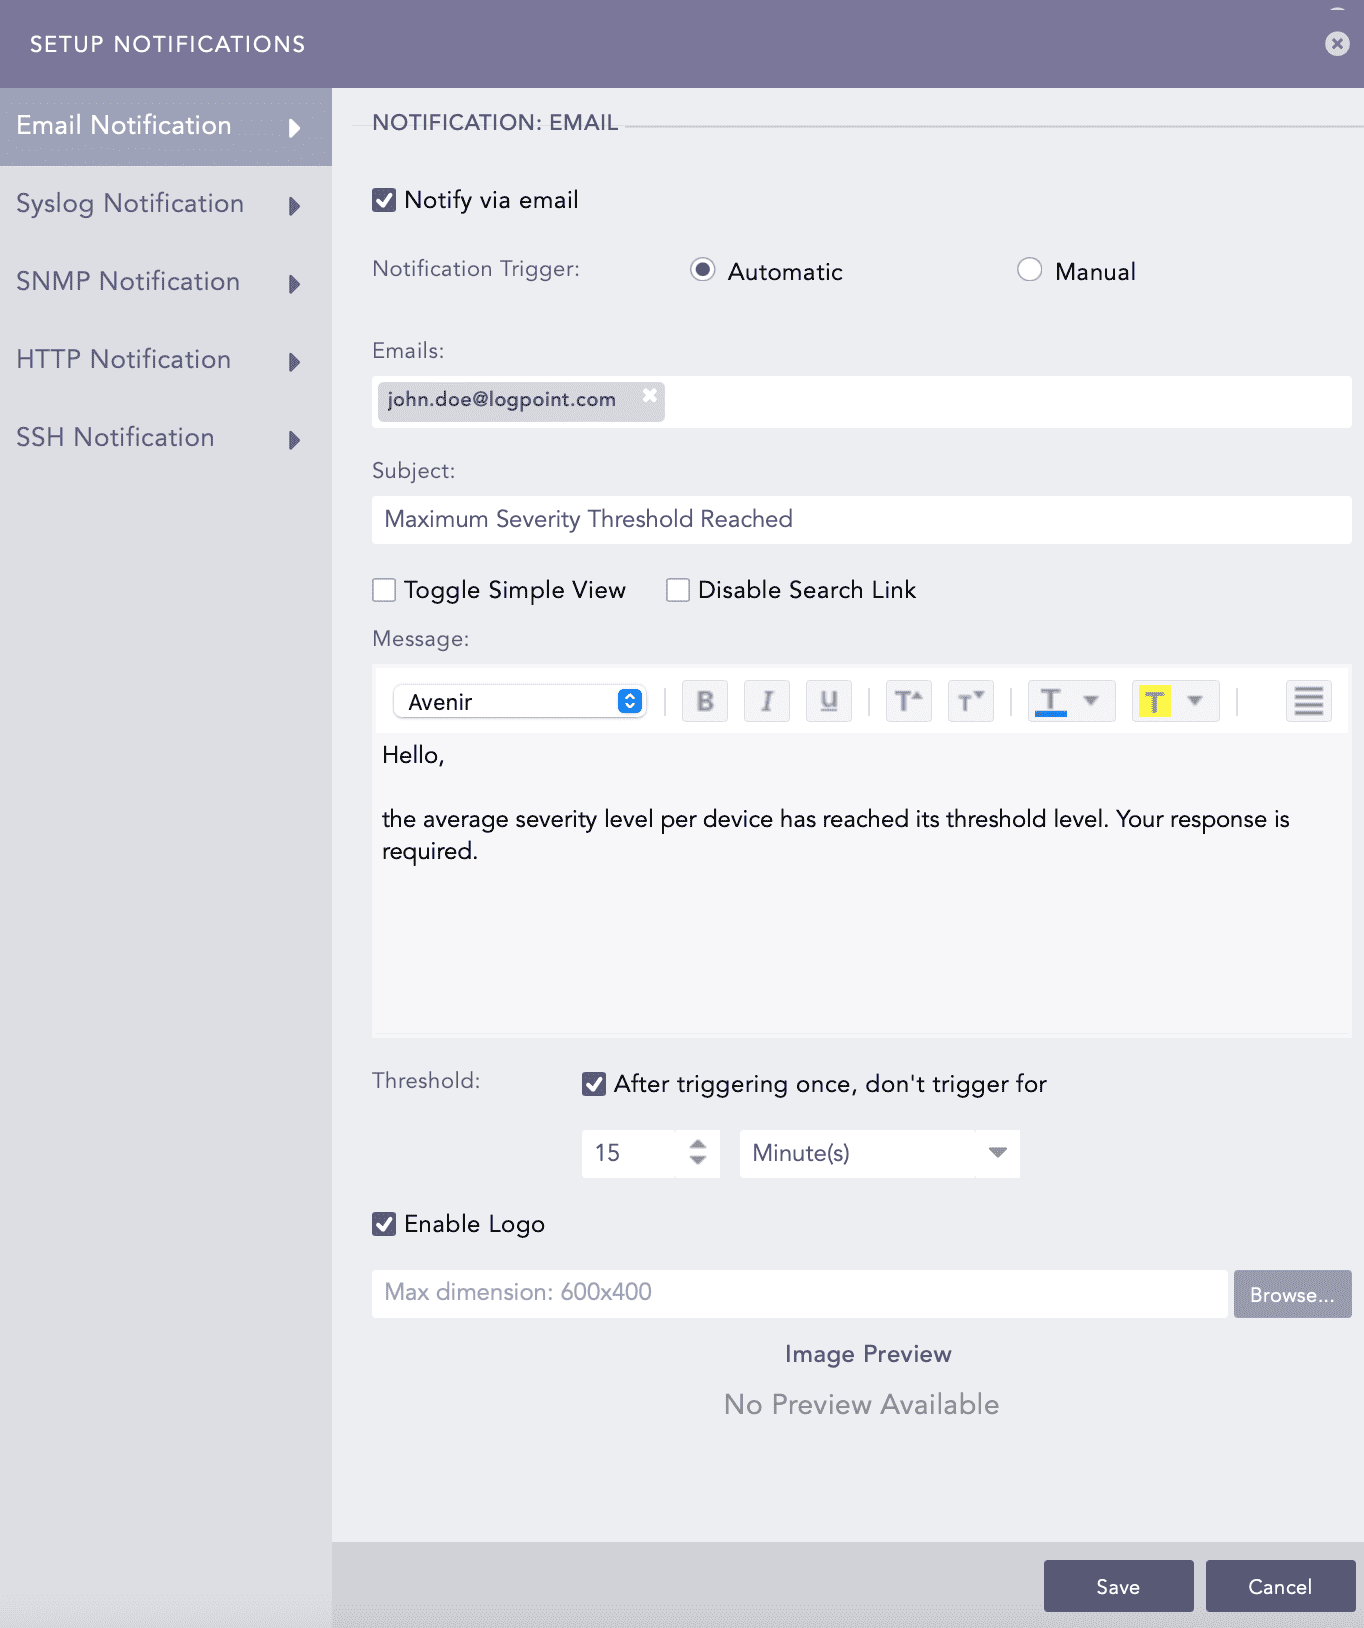
Select Email Notification and enable Notify via email.
In the Notification Trigger section:
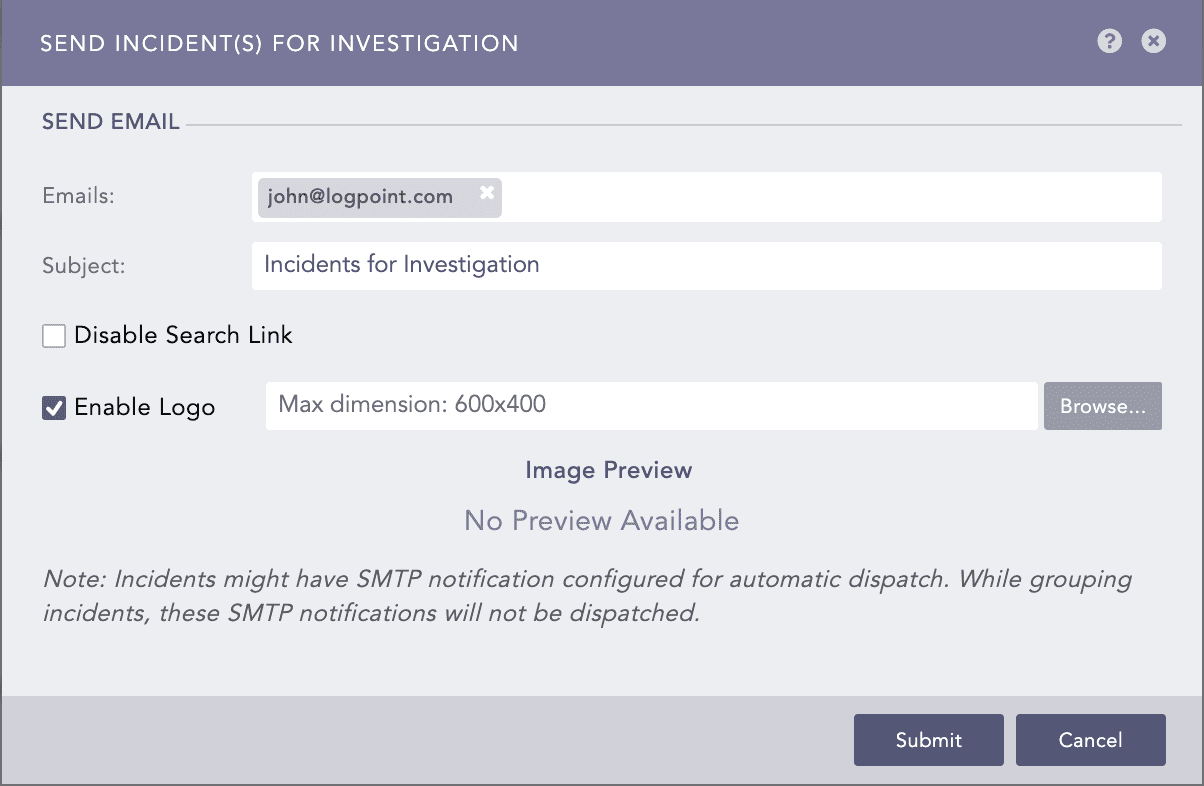
Enter valid email addresses under Emails.
Enter a Subject. Logpoint supports the following Jinja commands for the alert rules:
{{alert_name}}
{{detection_timestamp}}
{{risk_level}}
{rows}}
{{rows_count}}
You can write them in a query as: Logs from {{rows.col_type}} on date {{rows.col_ts|datetime}}.
Select Toggle Simple View to enable or disable the advanced text editor.
Select Disable Search Link to remove the search link in the email. The search link redirects to the search page of the LPSM machine from which the email notification is configured.
Enter a Message.
Set the Threshold.
Select Enable Logo if you want to include the Logpoint logo in the email notification.
Browse for the image in the JPG/JPEG format if you want to provide a custom logo. The maximum dimension for the custom logo is 600*400.
Click Save.
Note
You can use the Jinja commands {{attack_id}}, {{attack_tag}}, {{attack_category}}, and {{log_source}} in the Subject and Message fields. You can also use the metadata fields associated with the alert as Jinja commands in these Jinja supported fields. If the metadata fields associated with the alert are threatactor, Associated_Malware, and System, then you can use them as Jinja commands as {{threatactor}}, {{Associated_Malware}}, and {{System}}.
If you do not want to include the Logpoint logo in the email, deselect Enable Logo and click Save.
To configure the SMTP service, go to Settings >> System >> System Settings before sending email notifications. Go to the SMTP section for details.
Configuring SMS Notification
Before configuring SMS notification, the SMSC server must be accessible from Logpoint.
Go to Settings >> Logpoint Configuration >> Alert Rules.
Click the Setup Notification ( ) icon from the Actions.
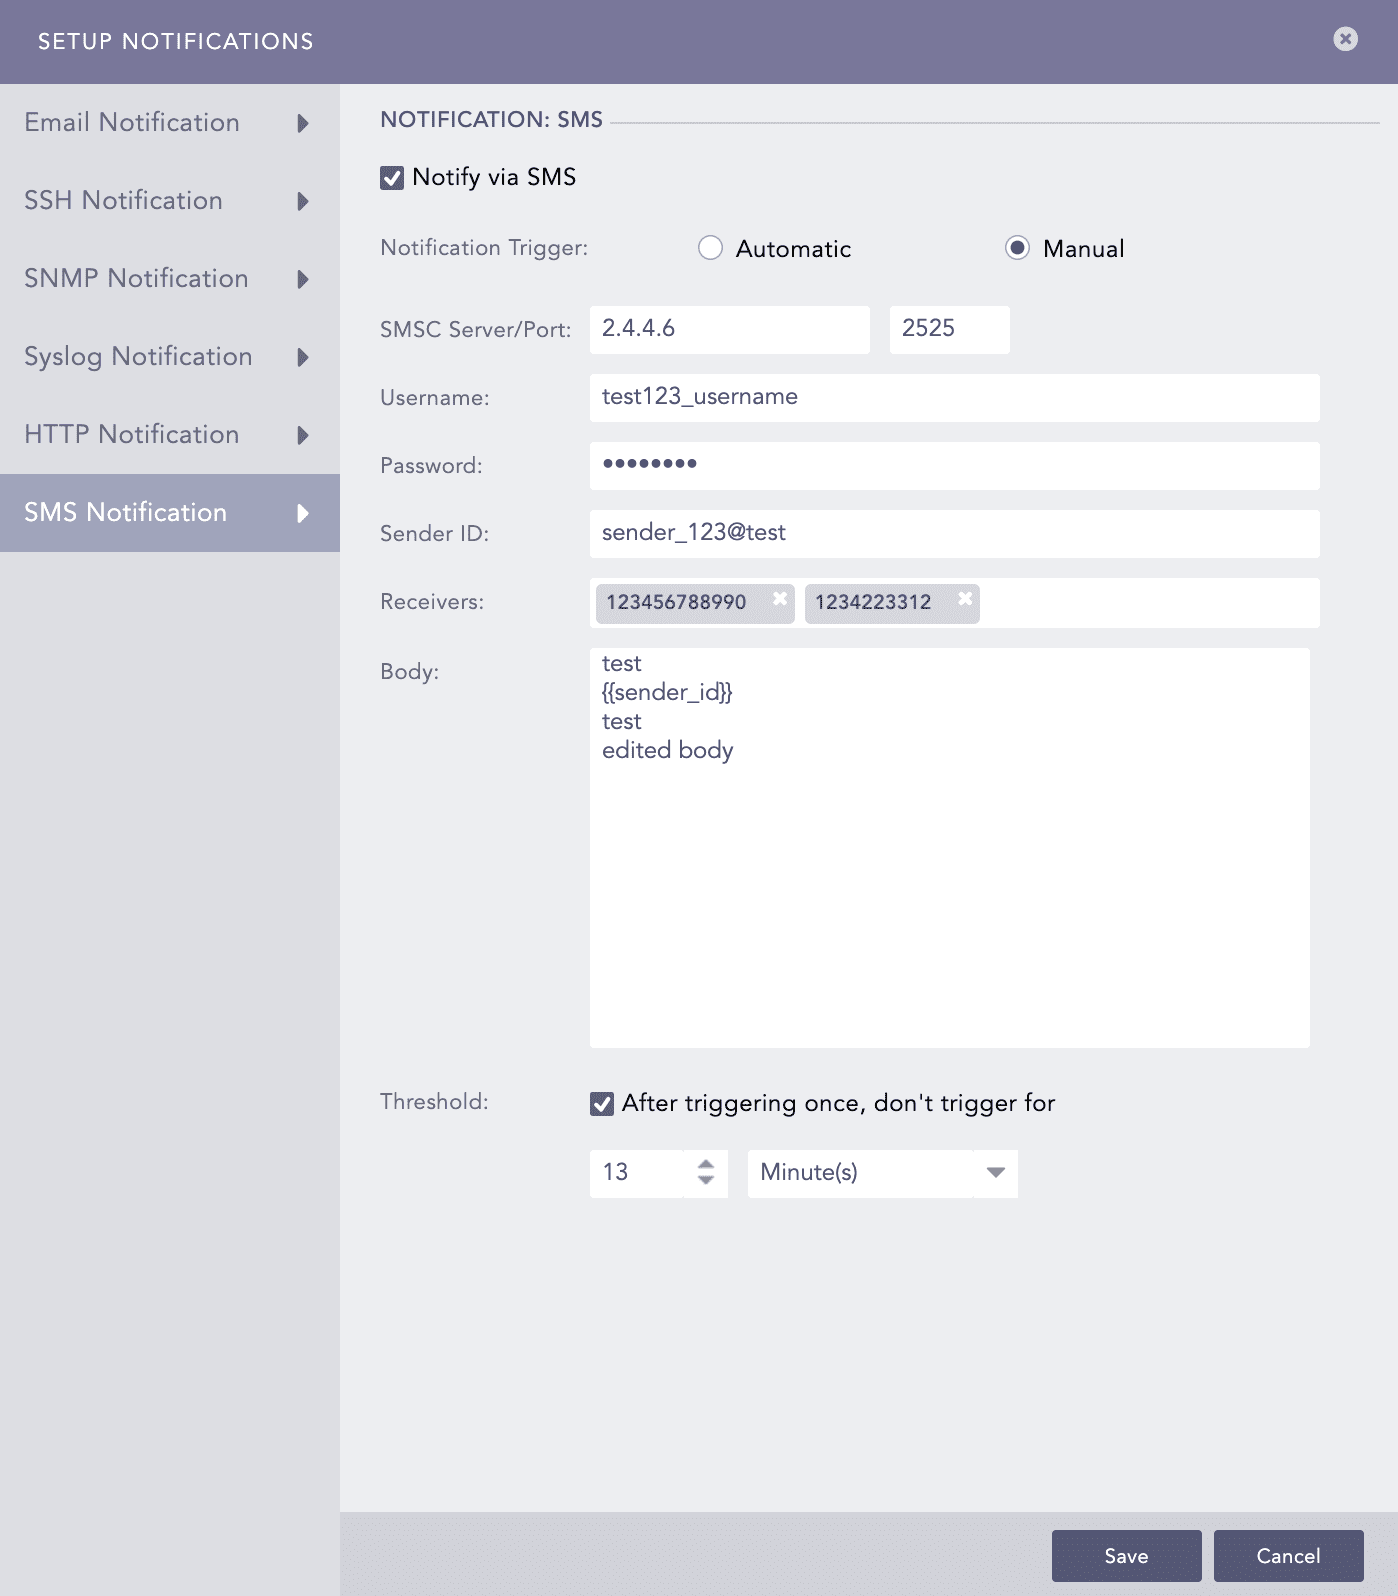
Select SMS Notification and enable Notify via SMS.
In Notification Trigger:
Enter SMSC Server/Port. the SMSC server supports both hostname and IP address.
Enter Username, Password, and Sender ID of the server.
In Receivers, enter the phone numbers including the country code.
In Body, enter a template in Jinja format for the SMS.
Set the Threshold time to trigger the SMS notification after enabling it.
Click Save.
Configuring Syslog Notification
Go to Settings >> Logpoint Configuration >> Alert Rules.
Click the Setup Notification icon from the Actions column of the alert rule.
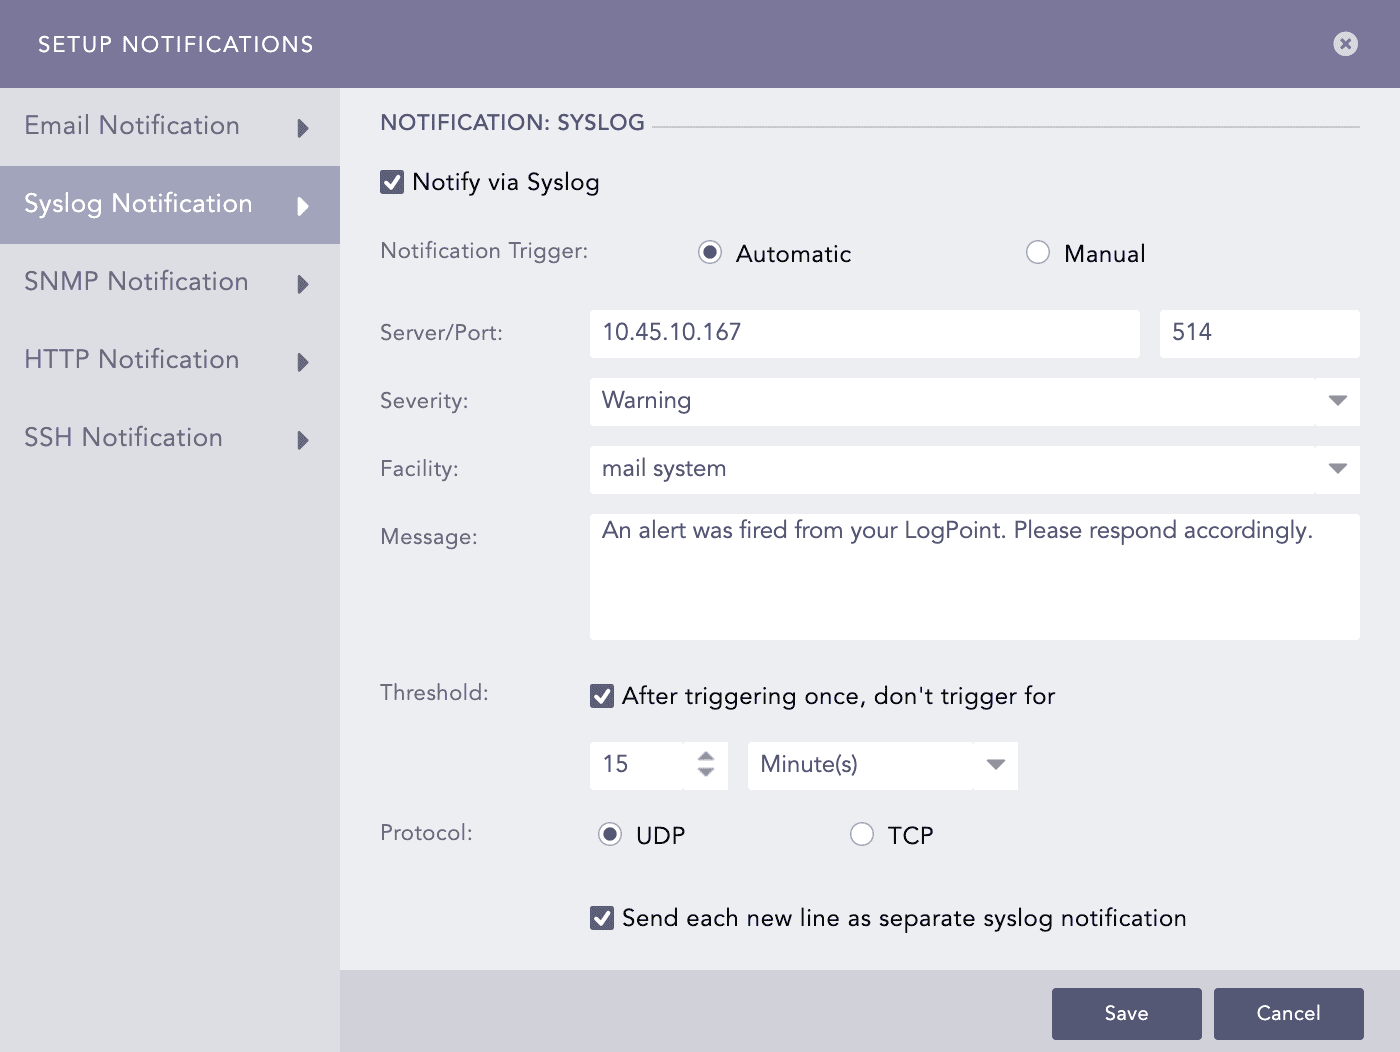
Select Syslog Notification and enable Notify via Syslog.
In the Notification Trigger section:
Enter the IP Address and the Port number for the syslog receiver in the Server/Port textboxes.
Select the level of Severity and Facility from the drop-downs.
Enter a Message that gives the information about the event. You can use the Jinja template to construct a message that extracts specific information about the event.
Note
You can use the Jinja commands {{attack_id}}, {{attack_tag}}, {{attack_category}}, and {{log_source}} in the Message field. You can also use the metadata fields associated with the alert as Jinja commands in these Jinja supported fields. If the metadata fields associated with the alert are threatactor, Associated_Malware, and System, then you can use them as Jinja commands as {{threatactor}}, {{Associated_Malware}}, and {{System}}.
Set the Threshold.
Choose either the UDP or the TCP protocol to send the Syslog Notification.
Note
If you use UDP, the log message may be dropped or it may arrive out of order.
If you use TCP, the log message arrives without being dropped and in order.
Select the Send each new line as separate syslog notification checkbox to generate one syslog message for each log message in the search results. If you do not select it, all the messages within the chosen time range of the incident are compressed into one syslog message in the search results.
Note
The Send each new line as separate syslog notification option is useful only if the Message textbox contains a Jinja template with a for loop.
Configuring SNMP Notification
Go to Settings >> Logpoint Configuration >> Alert Rules.
Click the Setup Notification icon from the Actions column of the alert rule.
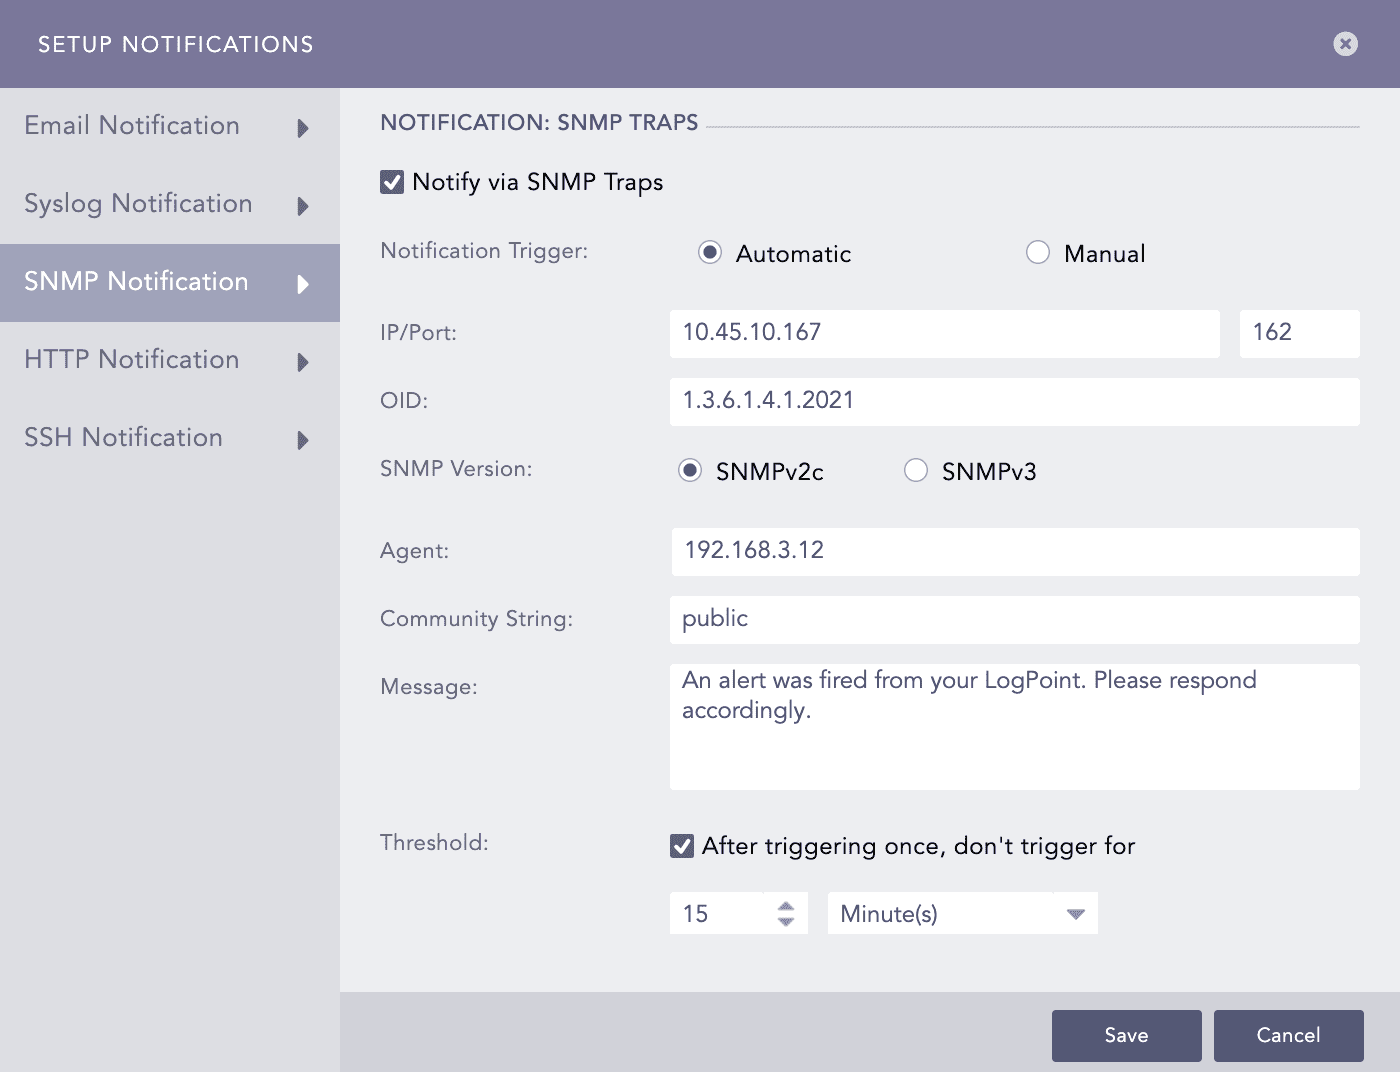
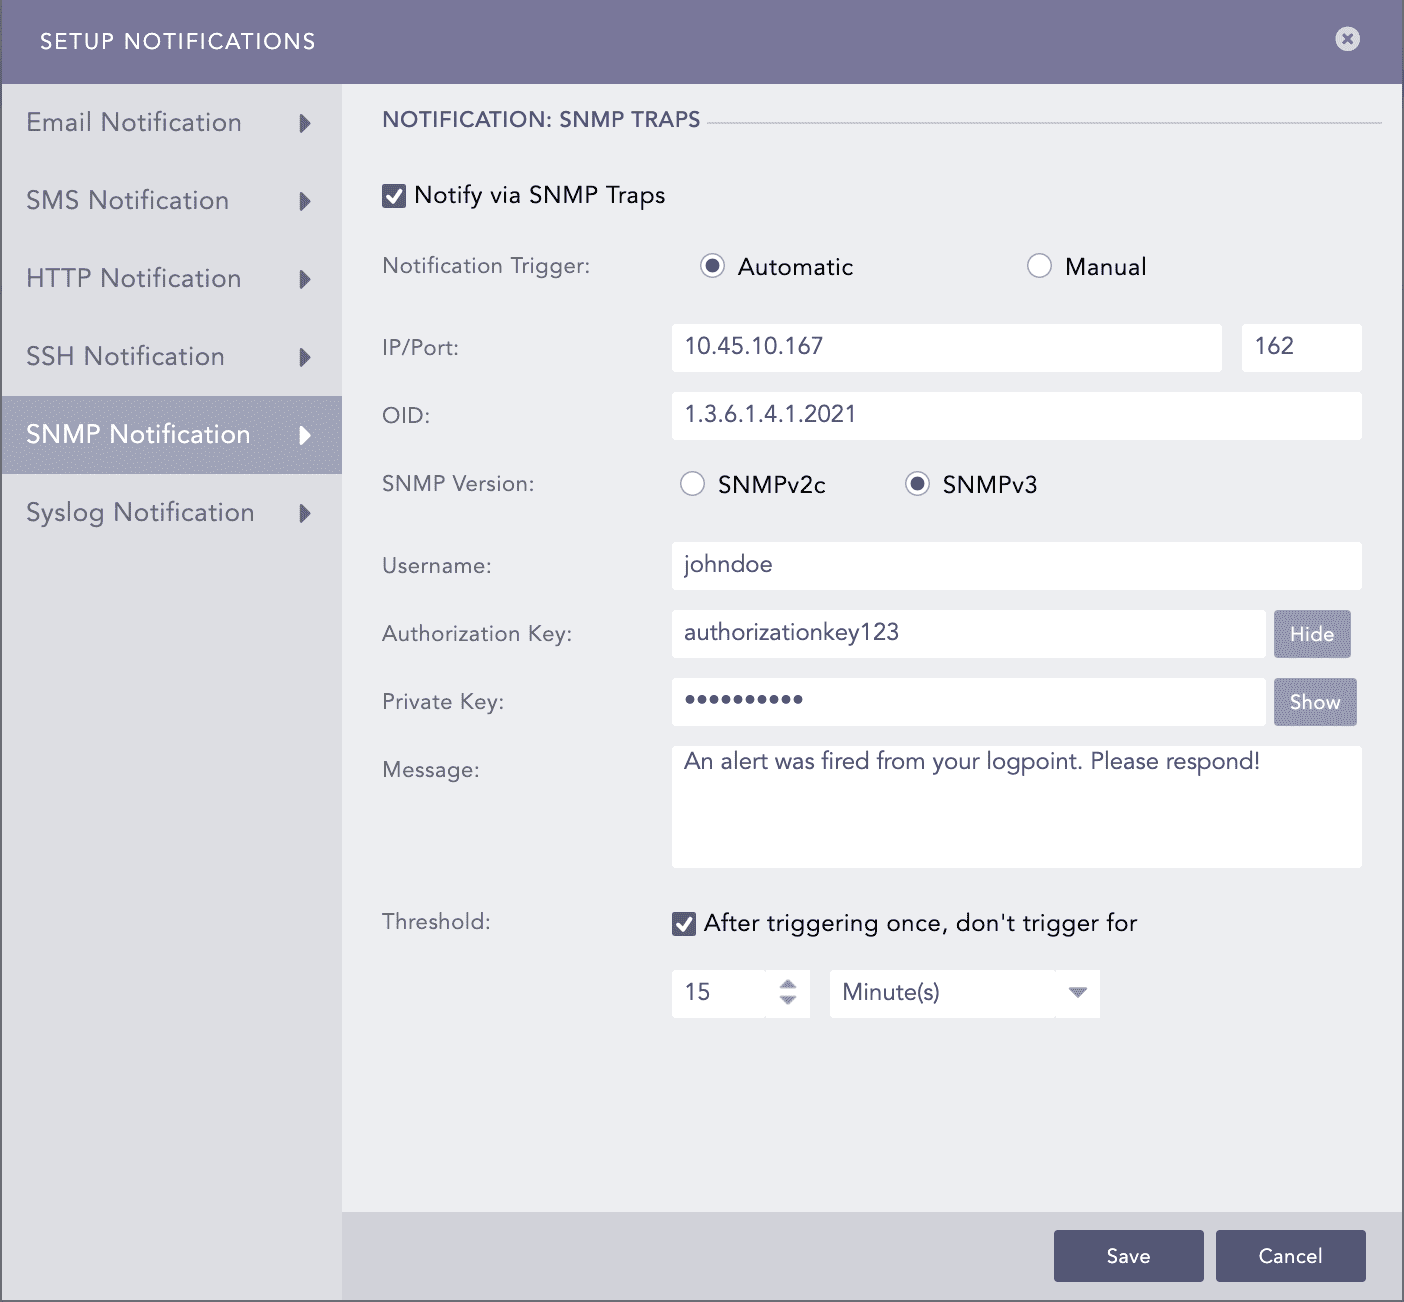
Select SNMP Notification and enable Notify via SNMP Traps.
In the Notification Trigger section:
Enter the trap receiver’s IP address and the Port number.
Enter a valid SNMP trap or Enterprise specific OID (Object Identifier) in the dotted decimal format. Make sure to not use the OID with a leading dot.
Select either the SNMPv2c version or the SNMPv3 version according to the security level you require.
The notification settings change according to the version you pick.
For SNMPv2c configuration
Enter the name of the Agent that sends the SNMP trap.
Enter a passphrase in the Community String. The passphrase should be recognizable by the manager.
Enter the OID’s corresponding value in the Message.
For SNMPv3c configuration
Enter the Username.
Enter the Authorization Key and Private Key.
Note
You can toggle the SHOW/HIDE button to show or hide the Authorization Key and Private Key.
At the Message tab, enter the OID’s corresponding value.
Note
You can use the Jinja commands {{attack_id}}, {{attack_tag}}, {{attack_category}}, and {{log_source}} in the Message field. You can also use the metadata fields associated with the alert as Jinja commands in these Jinja supported fields. If the metadata fields associated with the alert are threatactor, Associated_Malware, and System, then you can use them as Jinja commands as {{threatactor}}, {{Associated_Malware}}, and {{System}}.
Set the Threshold.
Click Save.
Configuring HTTP Notification
Go to Settings >> Logpoint Configuration >> Alert Rules.
Click the Setup Notification icon from the Actions column for the alert rule.
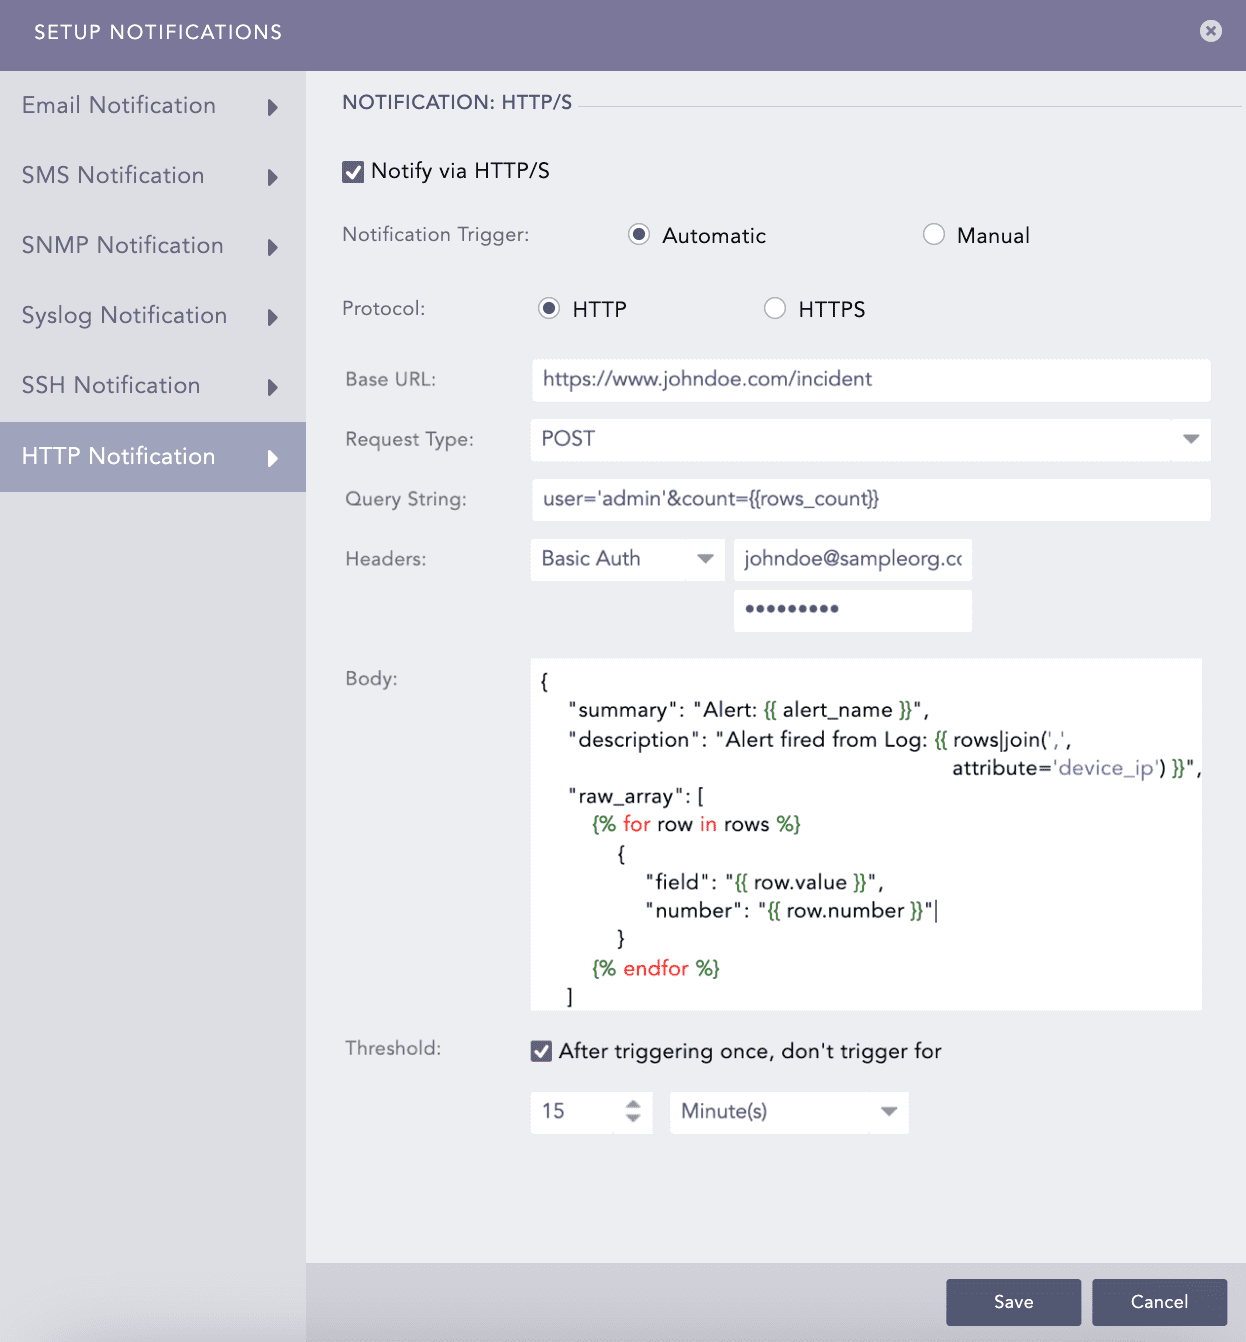
Select HTTP Notification and enable Notify via HTTP/S.
In Notification Trigger:
In Protocol:
Enter either a valid IP address or domain name in the Base URL field.
Select a Request Type from the drop-down.
Enter a Query String. Logpoint supports the following Jinja commands for the alert rules:
{{alert_name}}
{{detection_timestamp}}
{{risk_level}}
{{rows}}
{{rows_count}}
You can write them in a query as: user='admin'&count={{rows_count}}.
Select an authentication Header type.
If you select Basic Auth, enter the required Key and Password.
If you choose API Token, enter the required Key and Value.
If you select Bearer Token, enter the required Key.
Enter a template for the Body of the HTTP notification in the Jinja format.
Note
You can enter the template Body only for the POST, PUT, and PATCH request methods.
Set the Threshold. Threshold is a time after which next HTTP/S notification can be triggered.
Click Save.
Configuring SSH Notification
Go to Settings >> Logpoint Configuration >> Alert Rules.
Click the Setup Notification icon from the Actions column of the alert rule.
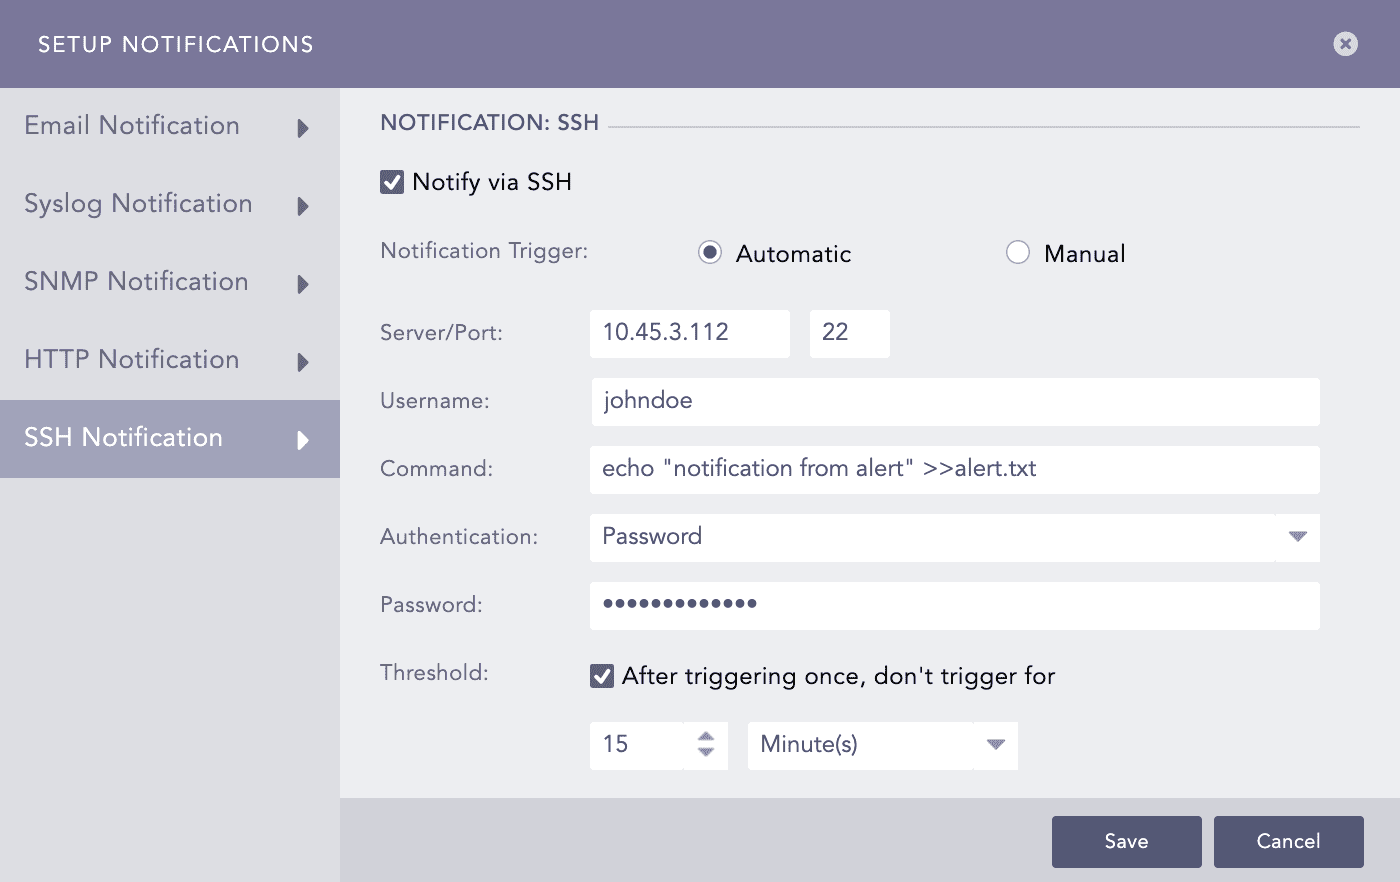
Select SSH Notification and enable Notify via SSH.
In the Notification Trigger section:
Enter a Server address and a Port number.
Enter a Username for the user in the destination server.
Enter a Command you want to execute when the alert rule is fired. Make sure that the command is a valid bash command and is executable.
Note
You can use the Jinja commands {{attack_id}}, {{attack_tag}}, {{attack_category}}, and {{log_source}} in the Message field. You can also use the metadata fields associated with the alert as Jinja commands in these Jinja supported fields. If the metadata fields associated with the alert are threatactor, Associated_Malware, and System, then you can use them as Jinja commands as {{threatactor}}, {{Associated_Malware}}, and {{System}}.
Choose the required mode of Authentication: Password or SSH Certificate.
If you choose Password, enter a passkey in the Password tab.
If you choose SSH Certificate, select the Certificate type: System Certificate or User Certificate. The SSH Certificate key is automatically generated. You must add the key to the authorized keys at ~/.ssh/authorized_keys in your system.
If you choose System Certificate, LPSM uses system-specific certificate for authentication.
If you choose User Certificate, LPSM uses individual user-specific certificate for authentication.
Please note the password or the SSH certificate key, as it is required later for user-validation.
Set the Threshold.
Click Finish.
Pushing Alert Rules
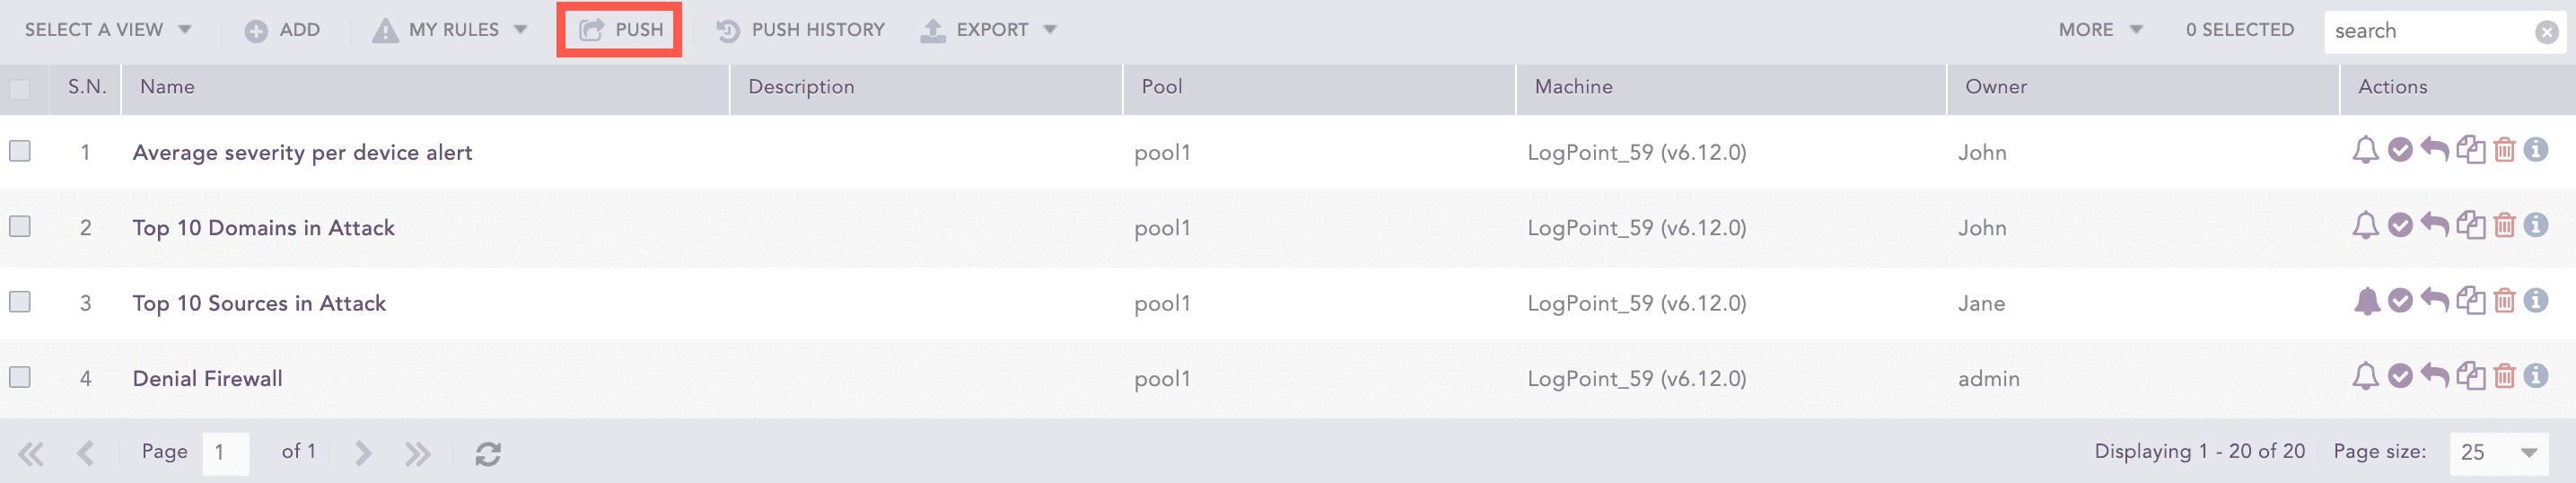
Go to Settings >> Logpoint Configuration >> Alert Rules.
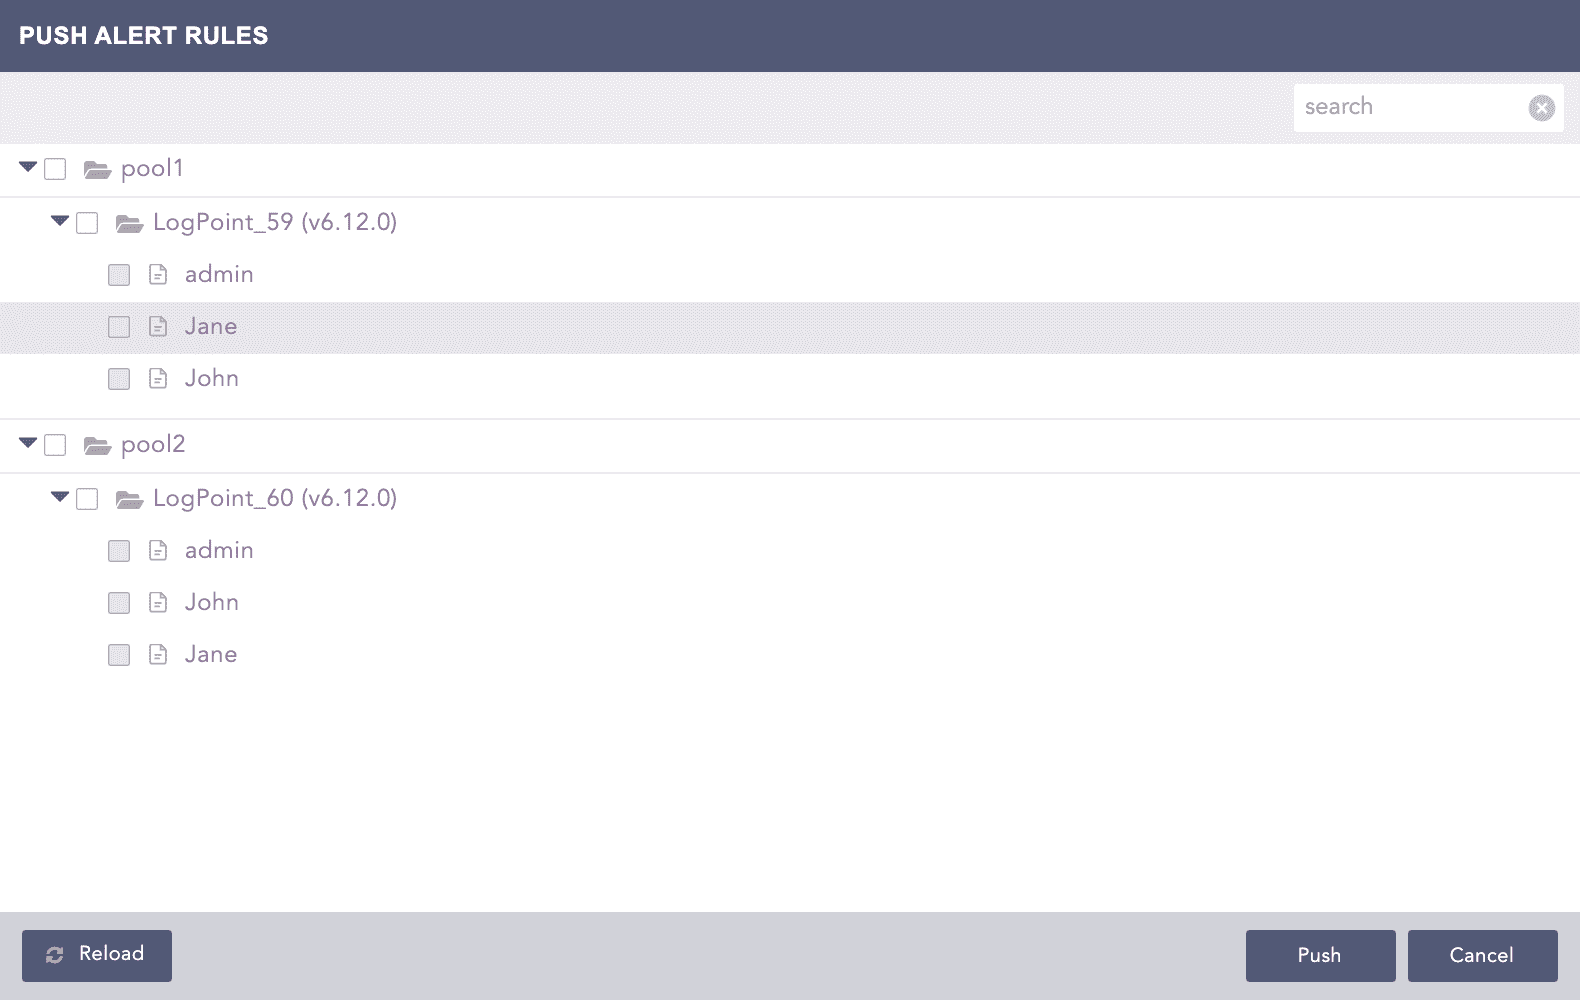
Select the alert rules and click Push.
The Push Alert Rules pop-up menu appears.
Note
You cannot push an alert rule from a Logpoint user to itself.
Select the Pool, Logpoint, or User where you want to push the selected alert rules.
Click Push.
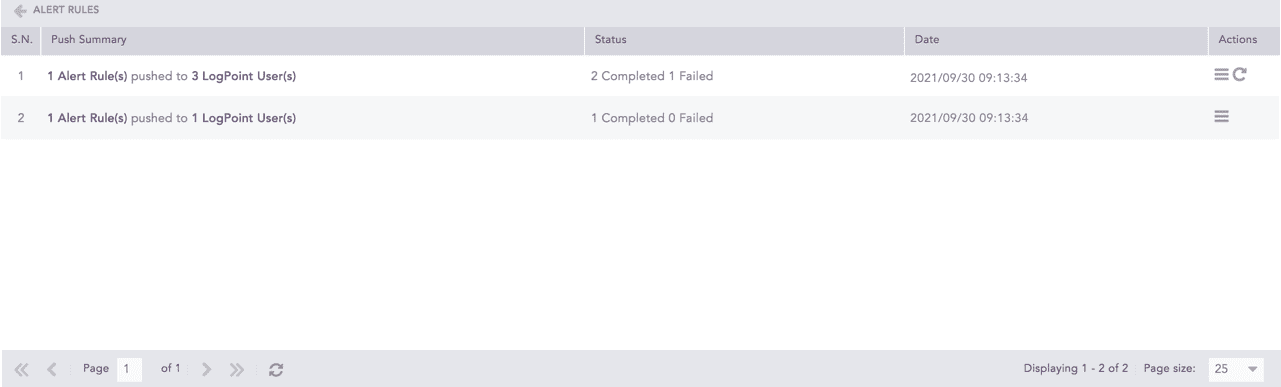
Push History
You can click the Push History ( ) button to check the push history.
The Push History page lists the Push Summary, Status, Date, and Actions of all push attempts.
Click the Retry ( ) icon from the Actions column to retry the failed push attempt.
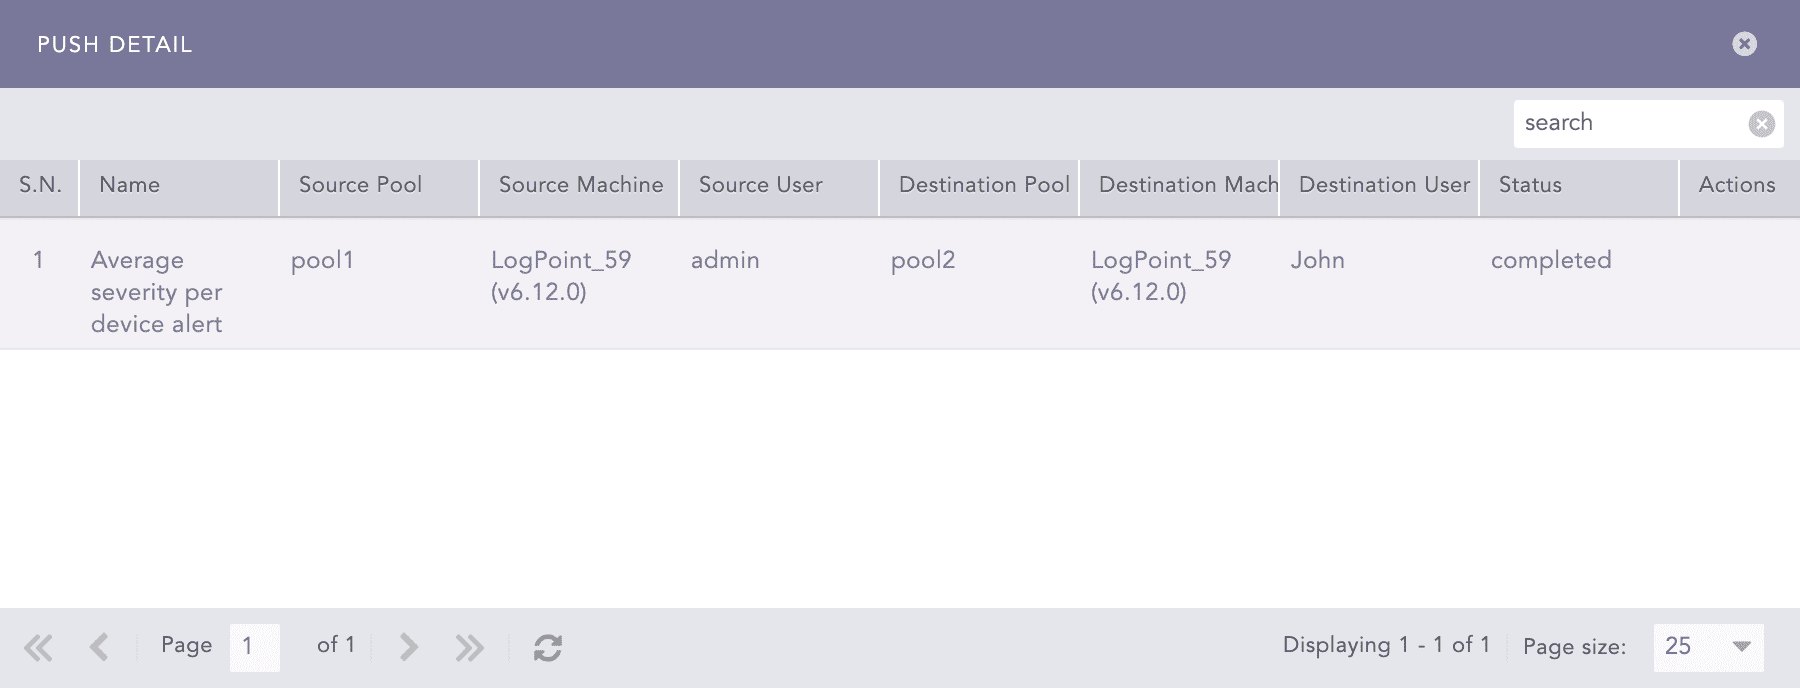
Click the Details ( ) icon from the Actions column to open the Push Detail page.
Note
For failed push attempts:
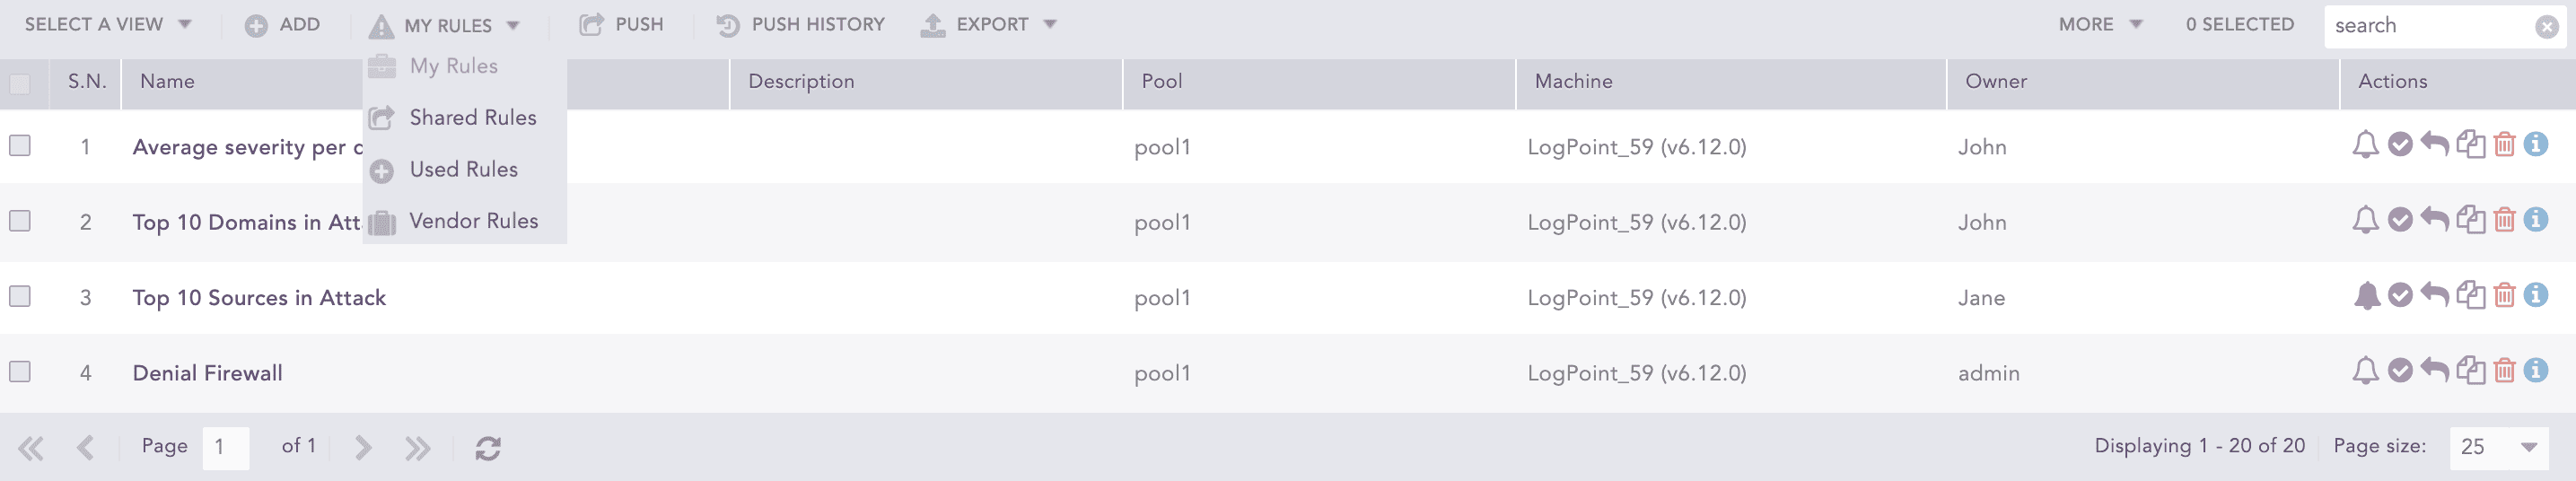
Category of Alert Rules
There are four categories of alert rules: My Rules, Shared Rules, Used Rules, and Vendor Rules. They can be accessed from the drop-down at the top-left corner of the panel.
My Rules
Lists all the alert rules created by the LPSM user or the Fabric-enabled Logpoint user.
Note
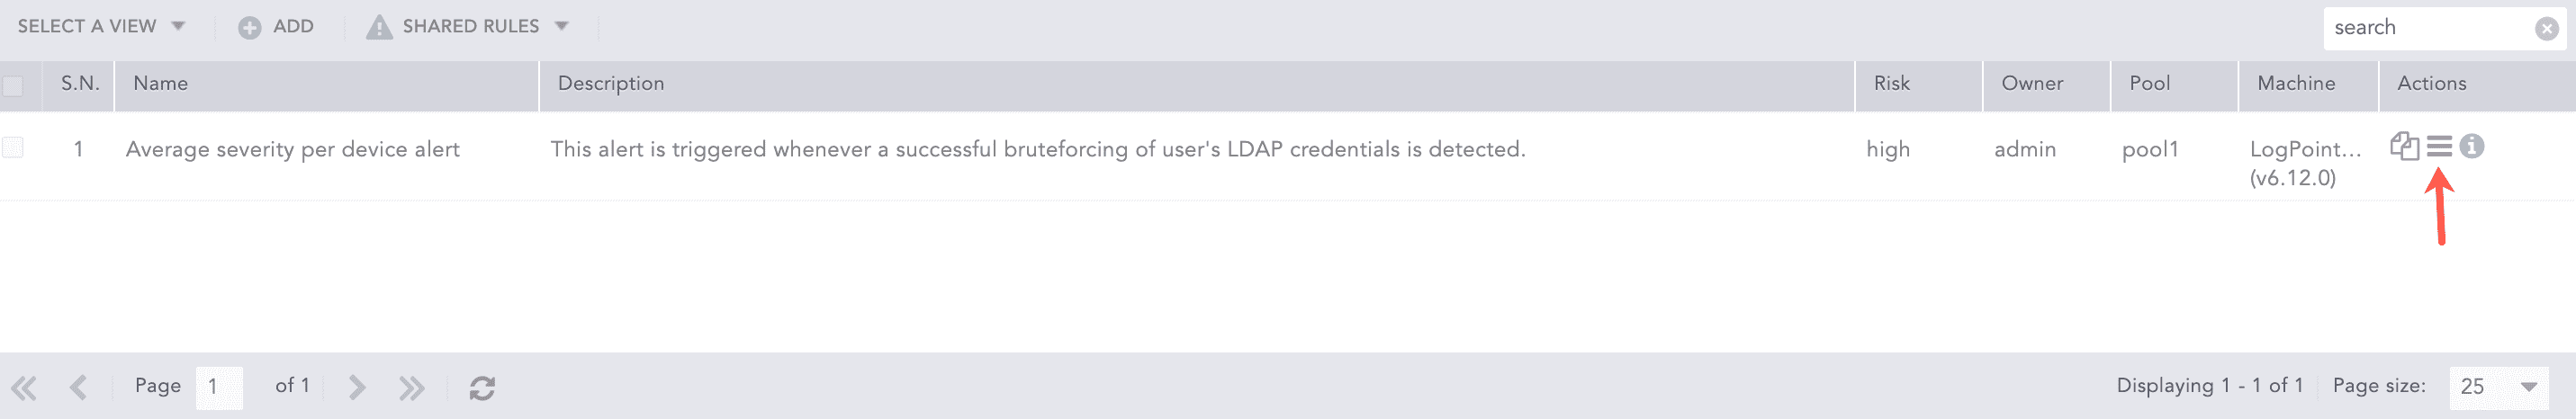
You can Setup Notifications, De-activate/ Activate, Share, Clone, or Delete alert rules under the Action column.
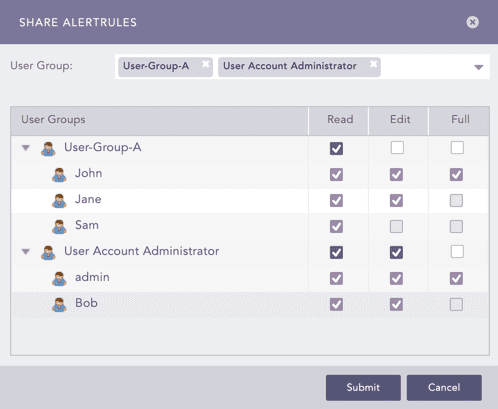
Shared Rules
Lists all the shared alert rules.
Used Rules
Lists all the used alert rules.
Vendor Rules
Lists all the alert rules provided in your application packages.
Note
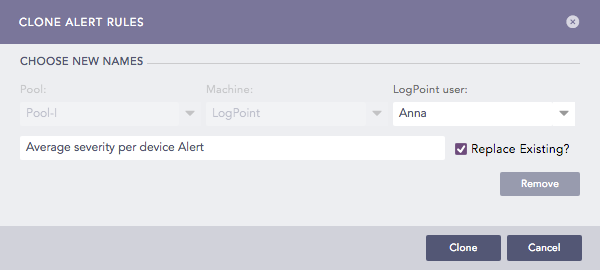
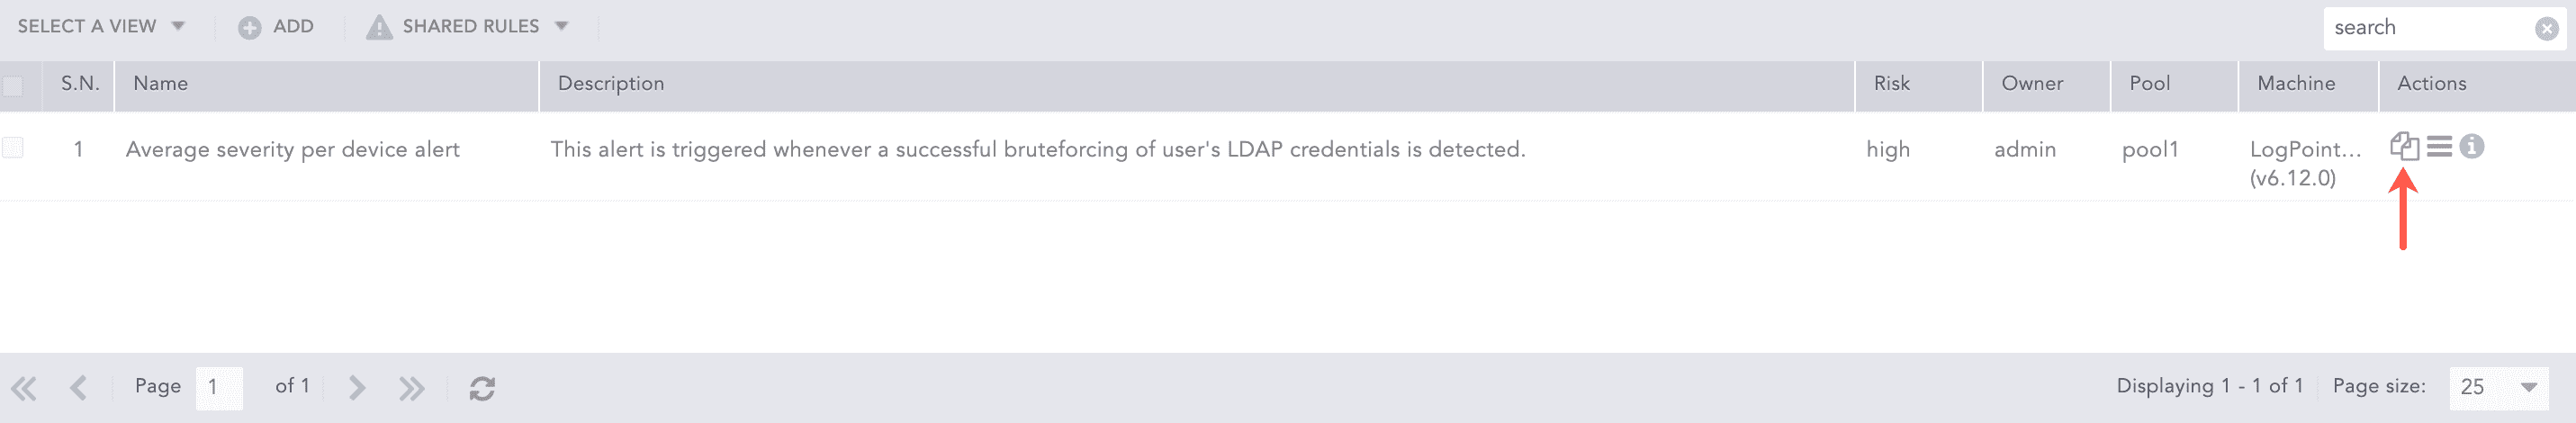
You can click the Clone ( ) icon under the Actions column, to use the shared and vendor alert rules. Enter a name for the clone and hit enter. The alert rule is activated, and the clone appears under the My Rules page.
 ) icon from the Actions column to view the error details about failed push attempts.
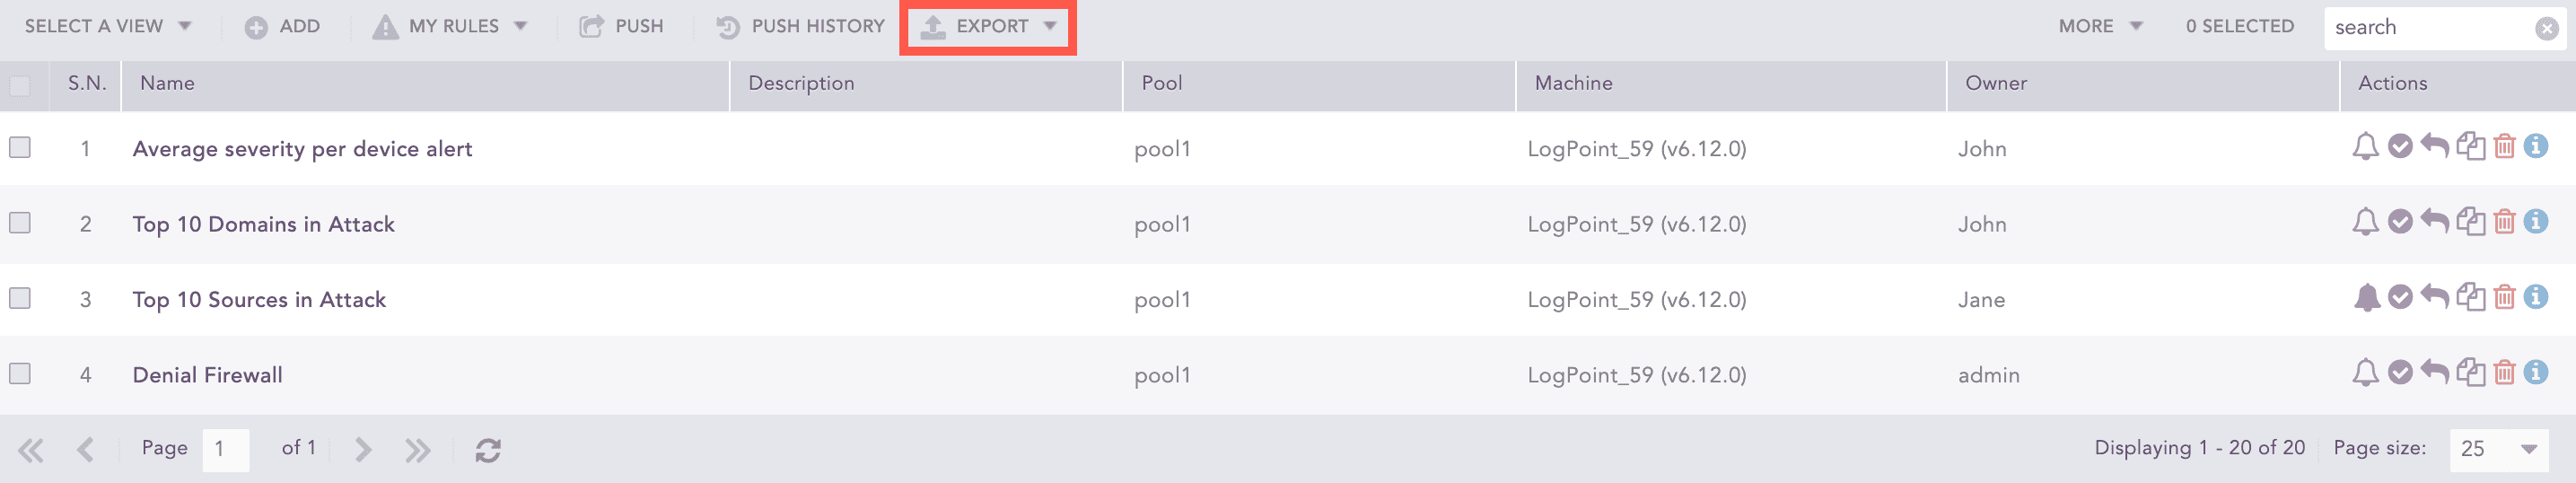
 ) icon from the Actions column for the alert rule.
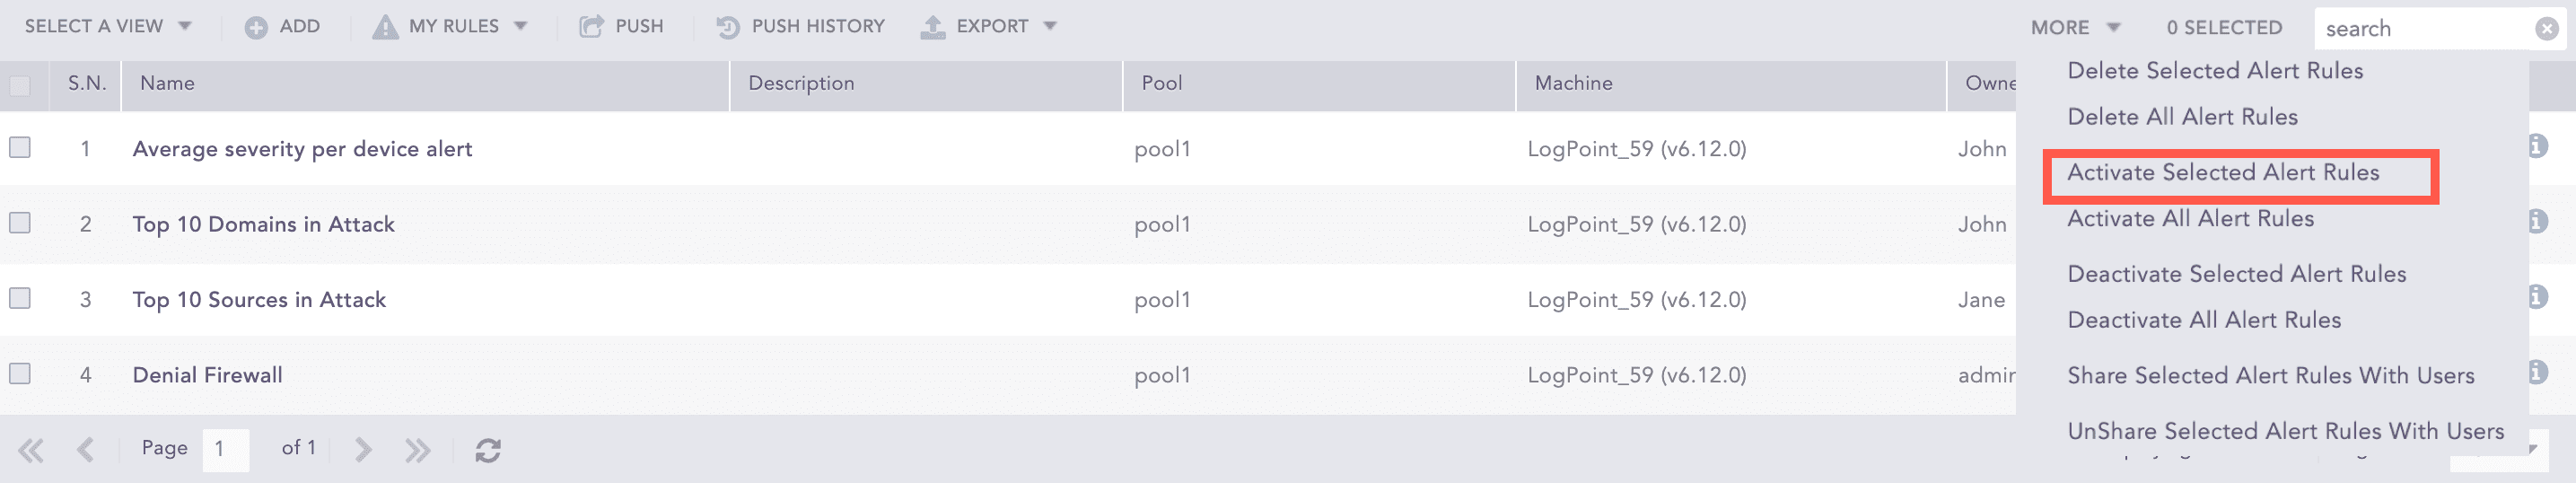
 ) icon.
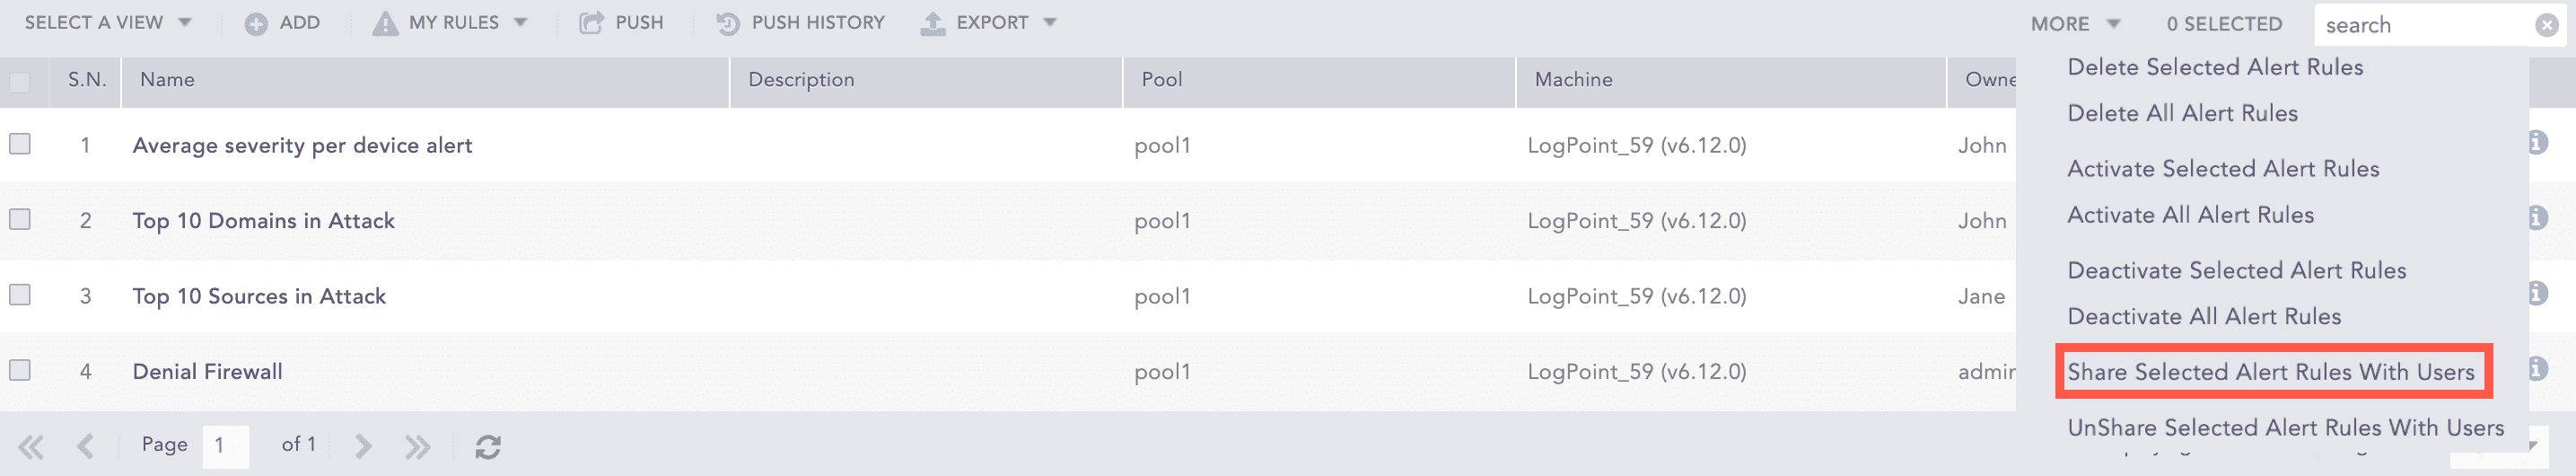


 ) icon on the redirected tab.